Here is an overview of this program at WMU. You can study it at the Bachelor’s level, with graduate study also available. It ranks as high as #11 out of 14 schools (Bachelor’s level) by College Factual. Jump to any of the following sections:
By College Factual’s measure, WMU highly for political science & government, ranked #601 out of 679 schools nationally.
Here is each degree level granted in political science & government at WMU, along with how many graduates complete each level annually.Degree Level Annual Graduates Bachelor’s 35 Master’s 2
During the most recent reporting year, Western Michigan University conferred 35 bachelor’s degrees in political science & government.
WMU holds a strong position among schools offering political science & government at the bachelor’s level. Specifically, it ranked #11 out of 14 schools by College Factual.
Political Science & Government graduates with a bachelor’s degree from WMU report a median salary of $47,068 a year. This is lower than $58,084, the median for all majors at WMU.
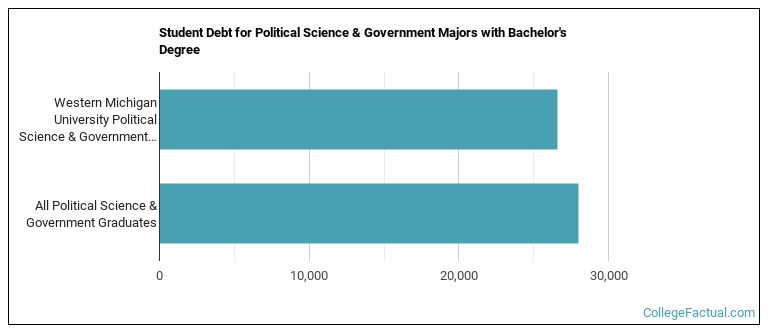
Earning a bachelor’s degree at WMU, political science & government students accumulate a median of $26,564 in student loans. This is below $27,999, the typical median for all majors at WMU.
The full-time undergraduate tuition and fees are shown below.In State Out of State Tuition $13,334 $19,826 Fees $126 $126
Find out more about WMU tuition and fees.
Among recent graduates, 49% of political science & government bachelor’s degrees went to men and 51% went to women.
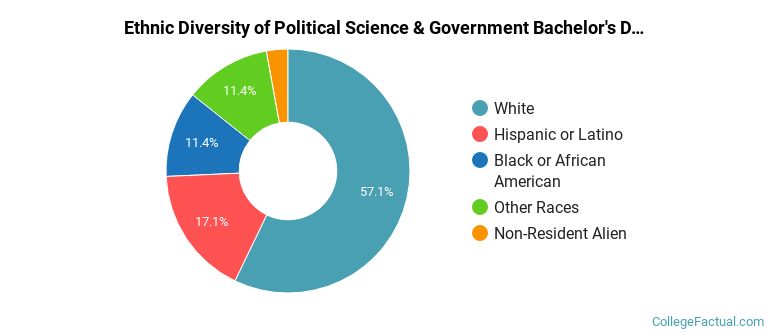
 The majority of political science & government bachelor’s degree graduates at WMU were White. Roughly 57% of graduates fell into this category.
The following table and chart show the ethnic background for students who recently graduated from Western Michigan University with a bachelor’s in political science & government.
| Ethnic Background | Number of Students |
|---|---|
| Asian | 0 |
| Black or African American | 4 |
| Hispanic or Latino | 6 |
| White | 20 |
| Non-Resident Aliens | 1 |
| Other Races | 4 |
WMU conferred 21 bachelor’s completions in political science and government, general in the latest year of data — 48% to women and 52% to men. The most common background among these graduates was White (81%).
WMU granted 12 bachelor’s degrees in political science and government, other recently — 67% to women and 33% to men. The largest share of these graduates were Hispanic or Latino (33%).
WMU awarded 2 bachelor’s completions in american government and politics (united states) in the most recent reporting year — 0% to women and 100% to men. The largest share of these graduates were Black or African American (50%).
You can also pursue this field at the graduate level at WMU. Here are the graduate award levels offered.Graduate Level Annual Graduates Master’s Degrees in Political Science & Government 2
