University of Pikeville Doctorate in Osteopathic Medicine/Osteopathy
Osteopathic Medicine/Osteopathy is a concentration offered under the osteopathic medicine major at University of Pikeville. We’ve pulled together some essential information you should know about the doctor’s degree program in osteopathic medicine/osteopathy, including how many students graduate each year, the ethnic diversity of these students, and more.
If there’s something special you’re looking for, you can use one of the links below to find it:
Featured schools near , edit
How Much Does a Doctorate in Osteopathic Medicine/Osteopathy from UPIKE Cost?
UPIKE Graduate Tuition and Fees
Part-time graduates at UPIKE paid an average of $450 per credit hour in 2018-2019. This tuition was the same for both in-state and out-of-state students. The following table shows the average full-time tuition and fees for graduate student.
| In State | Out of State | |
|---|---|---|
| Tuition | $8,100 | $8,100 |
| Fees | $0 | $0 |
Does UPIKE Offer an Online Doctorate in Osteopathic Medicine/Osteopathy?
UPIKE does not offer an online option for its osteopathic medicine/osteopathy doctor’s degree program at this time. To see if the school offers distance learning options in other areas, visit the UPIKE Online Learning page.

UPIKE Doctorate Student Diversity for Osteopathic Medicine/Osteopathy
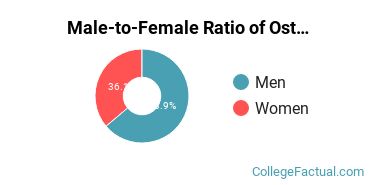
Male-to-Female Ratio
Women made up around 36.1% of the osteopathic medicine/osteopathy students who took home a doctor’s degree in 2018-2019. This is less than the nationwide number of 44.8%.
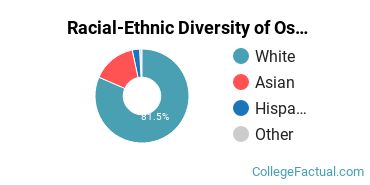
Racial-Ethnic Diversity
Around 18.5% of osteopathic medicine/osteopathy doctor’s degree recipients at UPIKE in 2018-2019 were awarded to racial-ethnic minorities*. This is lower than the nationwide number of 33%.
| Race/Ethnicity | Number of Students |
|---|---|
| Asian | 18 |
| Black or African American | 1 |
| Hispanic or Latino | 3 |
| Native American or Alaska Native | 0 |
| Native Hawaiian or Pacific Islander | 0 |
| White | 97 |
| International Students | 0 |
| Other Races/Ethnicities | 0 |
References
*The racial-ethnic minorities count is calculated by taking the total number of students and subtracting white students, international students, and students whose race/ethnicity was unknown. This number is then divided by the total number of students at the school to obtain the racial-ethnic minorities percentage.
More about our data sources and methodologies.
Featured Schools
College Factual provides higher-education, college and university, degree, program, career, salary, and other helpful information to students, faculty, institutions, and other internet audiences. Presented information and data are subject to change. Inclusion on this website does not imply or represent a direct relationship with the company, school, or brand. Information, though believed correct at time of publication, may not be correct, and no warranty is provided. Contact the schools to verify any information before relying on it. Financial aid may be available for those who qualify. The displayed options may include sponsored or recommended results, not necessarily based on your preferences.
© College Factual – All Rights Reserved.