Engineering is a program of study at Southern Methodist University. The school offers a bachelor’s degree in the area. We’ve pulled together some essential information you should know about the bachelor’s degree program in engineering, including how many students graduate each year, the ethnic diversity of these students, whether or not the degree is offered online, and more.
You can jump to any section of this page using the links below:
In order to help students and their parents find the best school for them, we have created several different types of college rankings, which are updated yearly. The bachelor's program at SMU was ranked #146 on College Factual's Best Schools for engineering list. It is also ranked #8 in Texas.
Here are some of the other rankings for SMU.
During the 2019-2020 academic year, part-time undergraduate students at SMU paid an average of $2,171 per credit hour. No discount was available for in-state students. Information about average full-time undergraduate tuition and fees is shown in the table below.
| In State | Out of State | |
|---|---|---|
| Tuition | $51,958 | $51,958 |
| Fees | $6,582 | $6,582 |
| Books and Supplies | $800 | $800 |
| On Campus Room and Board | $17,110 | $17,110 |
| On Campus Other Expenses | $2,600 | $2,600 |
Learn more about SMU tuition and fees.
Online degrees for the SMU engineering bachelor’s degree program are not available at this time. To see if the school offers distance learning options in other areas, visit the SMU Online Learning page.
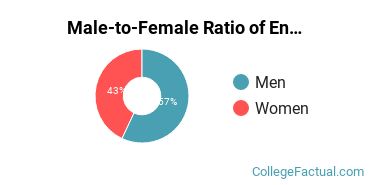
About 37.6% of the students who received their BS in engineering in 2019-2020 were women. This is higher than the nationwide number of 23.9%.
Around 29.5% of engineering bachelor’s degree recipients at SMU in 2019-2020 were awarded to racial-ethnic minorities*. This is about the same as the nationwide number of 31%.
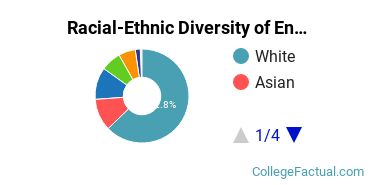
| Race/Ethnicity | Number of Students |
|---|---|
| Asian | 15 |
| Black or African American | 7 |
| Hispanic or Latino | 22 |
| Native American or Alaska Native | 0 |
| Native Hawaiian or Pacific Islander | 0 |
| White | 106 |
| International Students | 16 |
| Other Races/Ethnicities | 7 |
Engineering students may decide to major in one of the following focus areas.
| Focus Area | Annual Graduates |
|---|---|
| Civil Engineering | 20 |
| Computer Engineering | 4 |
| Electrical Engineering | 22 |
| Environmental Engineering | 11 |
| Mechanical Engineering | 79 |
*The racial-ethnic minorities count is calculated by taking the total number of students and subtracting white students, international students, and students whose race/ethnicity was unknown. This number is then divided by the total number of students at the school to obtain the racial-ethnic minorities percentage.
More about our data sources and methodologies.
