We've pulled together some essential information you should know about the program, including how many students graduate each year, the ethnic diversity of these students, average starting salaries, and more. We've also included details on how Monmouth ranks compared to other colleges offering a major in social work.
Go directly to any of the following sections:
The bachelor's program at Monmouth was ranked #103 on College Factual's Best Schools for social work list. It is also ranked #6 in New Jersey.
During the 2020-2021 academic year, Monmouth University handed out 43 bachelor's degrees in social work. This is an increase of 8% over the previous year when 40 degrees were handed out.
In 2021, 105 students received their master’s degree in social work from Monmouth. This makes it the #87 most popular school for social work master’s degree candidates in the country.
Social Work majors who earn their bachelor's degree from Monmouth go on to jobs where they make a median salary of $42,523 a year. This is great news for graduates of the program, since this figure is higher than the national average of $31,866 for all social work bachelor's degree recipients.

Social Work majors graduating with a master's degree from Monmouth make a median salary of $47,063 a year. This is a better than average outcome since the median salary for all social work graduates with a master's is $44,064.

While getting their bachelor's degree at Monmouth, social work students borrow a median amount of $27,000 in student loans. This is about the same as the median debt load of allsocial work bachelor's degree recipients across the nation.
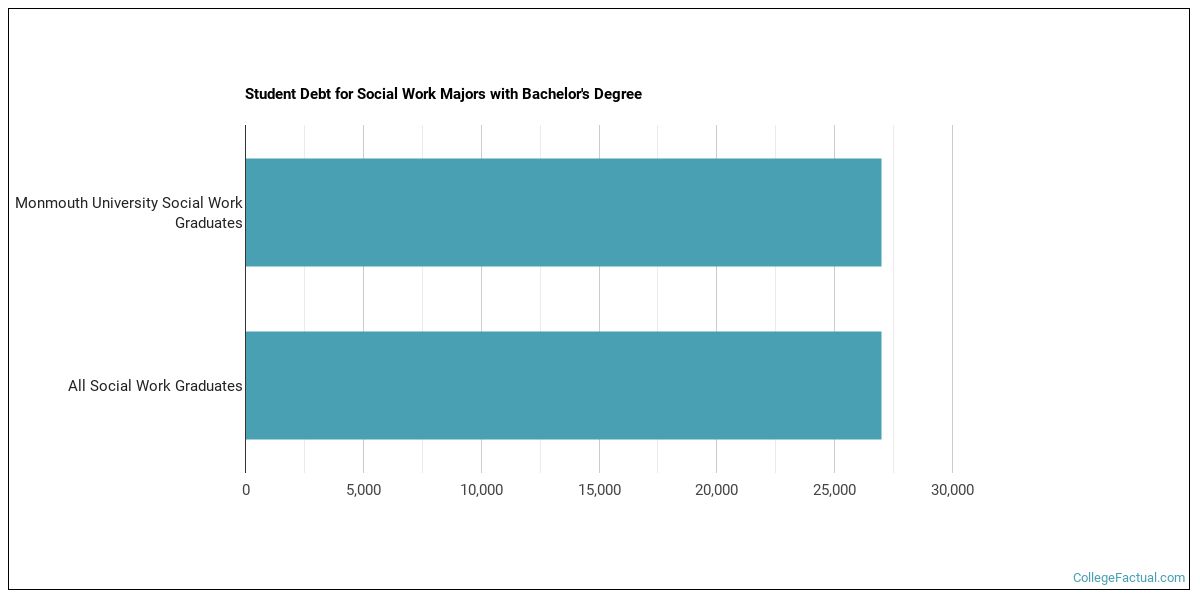
The typical student loan payment of a bachelor's degree student from the social work program at Monmouth is $777 per month.
Take a look at the following statistics related to the make-up of the social work majors at Monmouth University.
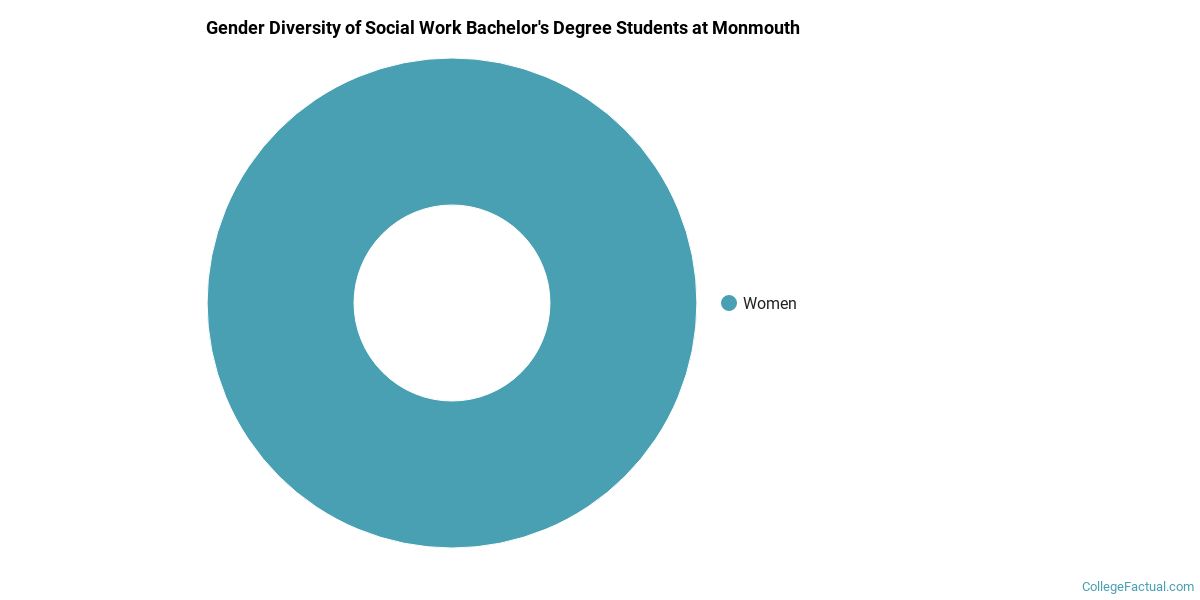
All of the 43 students who graduated with a Bachelor’s in social work from Monmouth in 2021 were women.
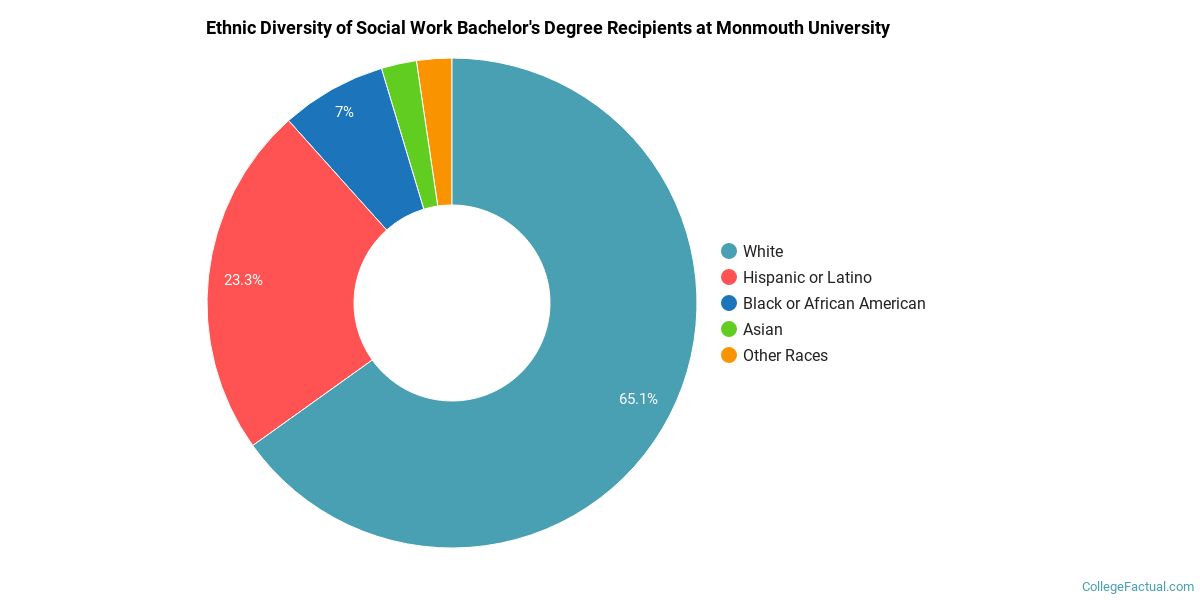
The majority of bachelor's degree recipients in this major at Monmouth are white. In the most recent graduating class for which data is available, 65% of students fell into this category.
The following table and chart show the ethnic background for students who recently graduated from Monmouth University with a bachelor's in social work.
| Ethnic Background | Number of Students |
|---|---|
| Asian | 1 |
| Black or African American | 3 |
| Hispanic or Latino | 10 |
| White | 28 |
| Non-Resident Aliens | 0 |
| Other Races | 1 |
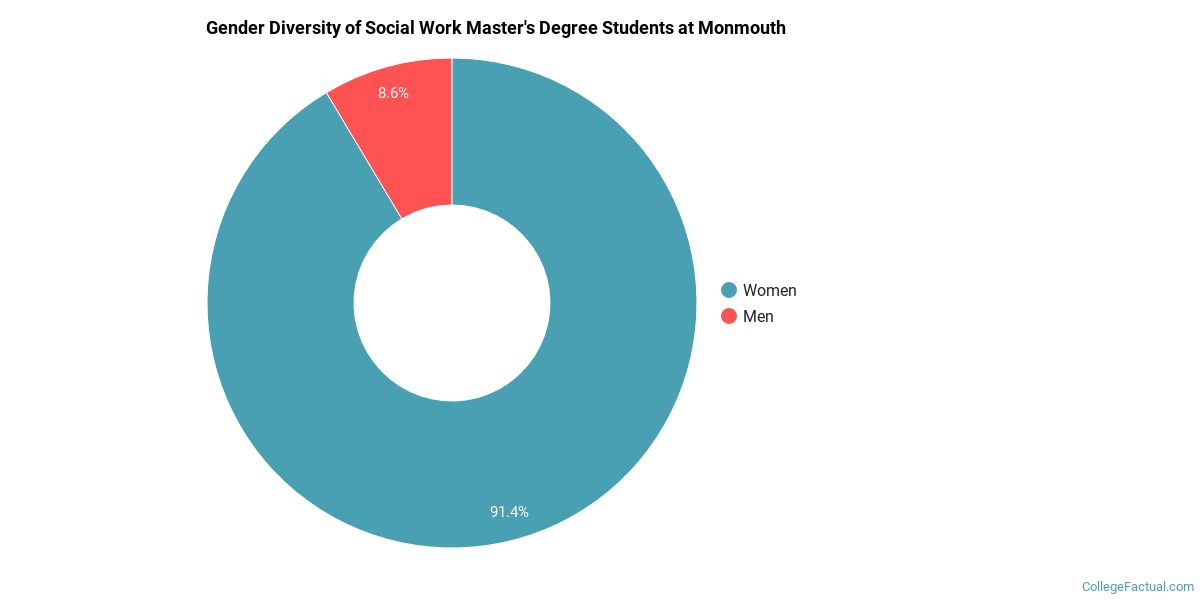
Of the 105 students who earned a master's degree in Social Work from Monmouth in 2020-2021, 9% were men and 91% were women.
The majority of master's degree recipients in this major at Monmouth are white. In the most recent graduating class for which data is available, 65% of students fell into this category.
The following table and chart show the ethnic background for students who recently graduated from Monmouth University with a master's in social work.
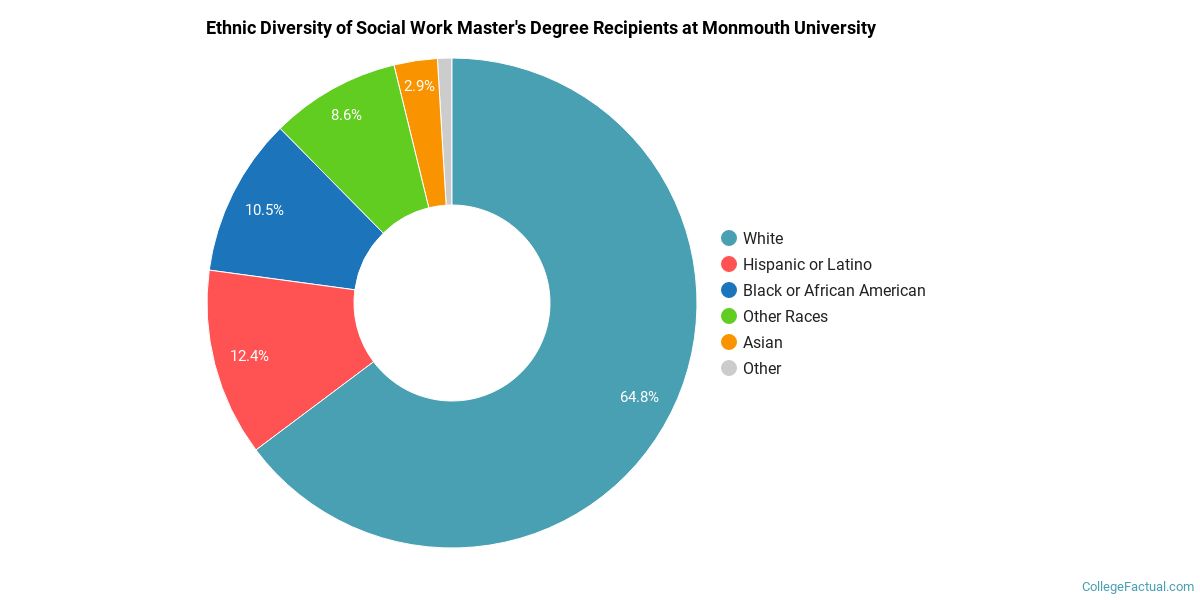
| Ethnic Background | Number of Students |
|---|---|
| Asian | 3 |
| Black or African American | 11 |
| Hispanic or Latino | 13 |
| White | 68 |
| Non-Resident Aliens | 1 |
| Other Races | 9 |
More about our data sources and methodologies.
