Silver Lake College Demographics & Diversity Report
Many schools pride themselves on their diversity, but what does that mean, really? College Factual analyzed the data to discover how diverse the typical college campus really is, including race, gender, the ages of the students, and where they're from. Keep reading the Silver Lake College diversity report to see how they stack up against the average.- Student Population
- Diversity Rankings
- Racial/Ethnic Diversity
- Male/Female Diversity
- Location Diversity
- Student Age Diversity
Featured schools near , edit
Silver Lake College Student Population
How Many Students Attend Silver Lake College of the Holy Family?
Silver Lake College total enrollment is approximately 448 students.
243 are undergraduates and 110 are graduate students.
Silver Lake College Undergraduate Population
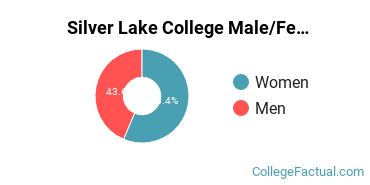
Male/Female Breakdown of Undergraduates
The full-time Silver Lake College undergraduate population is made up of 56% women, and 44% men.
For the gender breakdown for all students, go here.
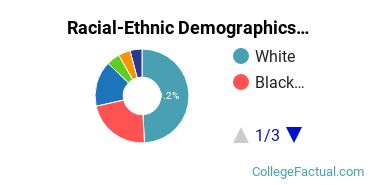
Silver Lake College Racial/Ethnic Breakdown of Undergraduates
| Race/Ethnicity | Number |
|---|---|
| White | 119 |
| Black or African American | 54 |
| Hispanic | 38 |
| Multi-Ethnic | 11 |
| International | 10 |
| Asian | 10 |
| Native Hawaiian or Pacific Islander | 0 |
| Unknown | 0 |
See racial/ethnic breakdown for all students.
Silver Lake College Graduate Student Population
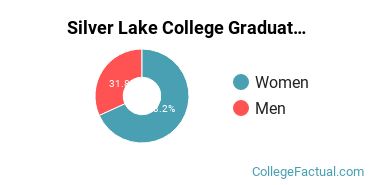
Male/Female Breakdown of Graduate Students
About 68% of full-time grad students are women, and 32% men.
For the gender breakdown for all students, go here.
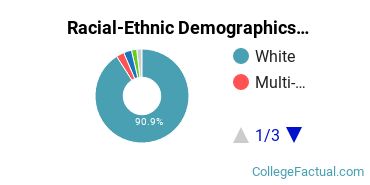
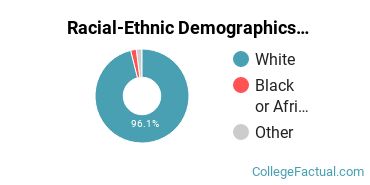
Silver Lake College Racial-Ethnic Breakdown of Graduate Students
| Race/Ethnicity | Number |
|---|---|
| White | 100 |
| Multi-Ethnic | 3 |
| Hispanic | 3 |
| Unknown | 2 |
| International | 1 |
| Asian | 1 |
| Native Hawaiian or Pacific Islander | 0 |
| Black or African American | 0 |
See racial/ethnic breakdown for all students.

Average Ranking in Overall Diversity Nationwide
Silver Lake College achieved a College Factual diversity rank of #1,843 out of 3,514 total schools in the ranking.
The overall diversity score is created by adding up the results of the racial-ethnic, geographic, age and male/female diversity rankings.
How Does Silver Lake College Diversity Compare to National Averages?
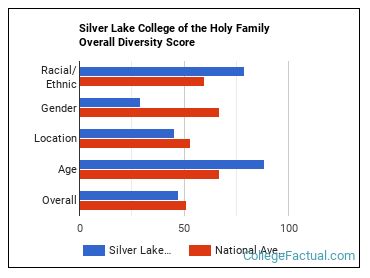
Silver Lake College is considered middle of the road when it comes to overall diversity. Some aspects of diversity may be stronger than others.
Above Average when it Comes to Racial/Ethnic Diversity
Silver Lake College is ranked 803 out of 3,790 when it comes to the racial/ethnic diversity of the students.
High racial diversity in the student body means plenty of opportunities to interact with and learn from students with different backgrounds and cultures than you.
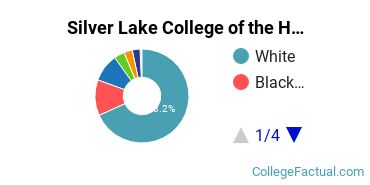
Silver Lake College Racial Demographics:
| Race/Ethnicity | Number |
|---|---|
| White | 305 |
| Black or African American | 55 |
| Hispanic | 43 |
| Multi-Ethnic | 16 |
| International | 13 |
| Asian | 12 |
| Unknown | 2 |
| Native Hawaiian or Pacific Islander | 1 |
Low Racial/Ethnic Diversity Among Faculty
Silver Lake College of the Holy Family Faculty Racial/Ethnic Demographics:
| Ethnicity | Number of Faculty |
|---|---|
| White | 98 |
| Black or African American | 2 |
| Asian | 1 |
| Multi-Ethnic | 1 |
| Hispanic | 0 |
| Native Hawaiian or Pacific Islander | 0 |
| International | 0 |
| Unknown | 0 |
Learn more about the faculty at Silver Lake College.
Average Male/Female Ratio
Silver Lake College ranks 2,692 out of 3,790 when it comes to gender parity on campus.
This school is more popular with women than with men.
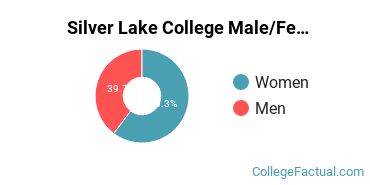
There are approximately 270 female students and 178 male students at Silver Lake College.
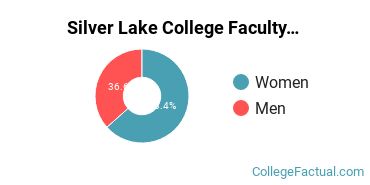
Close to Even Balance of Male & Female Teachers
Reporting of the gender of Silver Lake College is unknown or unavailable.
There are more female teachers than male teachers at this school.
More about Silver Lake College faculty.
There are approximately 71 female teachers and 41 male teachers.
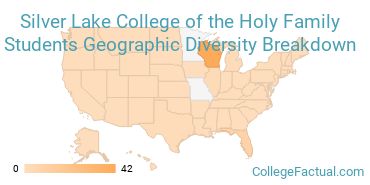
Average Geographic Diversity
Silver Lake College ranks 1,258 out of 2,183 when it comes to geographic diversity.
22.22% of Silver Lake College students come from out of state, and 1.79% come from out of the country.
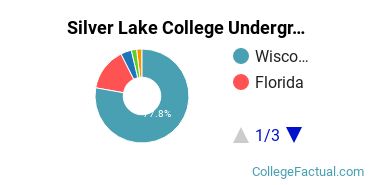
The undergraduate student body is split among 5 states (may include Washington D.C.). Click on the map for more detail.
Top 5 States
| State | Amount |
|---|---|
| Wisconsin | 42 |
| Florida | 8 |
| Illinois | 2 |
| Texas | 1 |
| Michigan | 1 |
International Students at Silver Lake College
Students from 11 countries are represented at this school, with the majority of the international students coming from Vietnam, Spain, and Serbia.
Learn more about international students at Silver Lake College.
High Student Age Diversity
A traditional college student is defined as being between the ages of 18-21. At Silver Lake College, 35.37% of students fall into that category, compared to the national average of 60%.
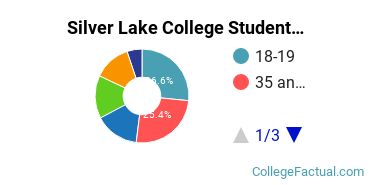
| Student Age Group | Amount |
|---|---|
| 18-19 | 108 |
| 35 and over | 103 |
| 25-29 | 62 |
| 20-21 | 60 |
| 22-24 | 52 |
| 30-34 | 21 |
| Under 18 | 0 |
Notes and References
Footnotes
*The racial-ethnic minorities count is calculated by taking the total number of students and subtracting white students, international students, and students whose race/ethnicity was unknown. This number is then divided by the total number of students at the school to obtain the racial-ethnic minorities percentage.
References
-
Department of Homeland Security Citizenship and Immigration Services
-
Read College Factual's Diversity Ranking Methodology.
College Factual provides higher-education, college and university, degree, program, career, salary, and other helpful information to students, faculty, institutions, and other internet audiences. Presented information and data are subject to change. Inclusion on this website does not imply or represent a direct relationship with the company, school, or brand. Information, though believed correct at time of publication, may not be correct, and no warranty is provided. Contact the schools to verify any information before relying on it. Financial aid may be available for those who qualify. The displayed options may include sponsored or recommended results, not necessarily based on your preferences.
© College Factual – All Rights Reserved.