UOPX - Virginia Demographics & Diversity Report
Featured schools near , edit
UOPX - Virginia Student Population
How Many Students Attend University of Phoenix - Virginia?
UOPX - Virginia total enrollment is approximately 31 students.
23 are undergraduates and 8 are graduate students.
UOPX - Virginia Undergraduate Population
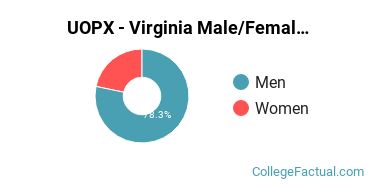
Male/Female Breakdown of Undergraduates
The full-time UOPX - Virginia undergraduate population is made up of 22% women, and 78% men.
For the gender breakdown for all students, go here.
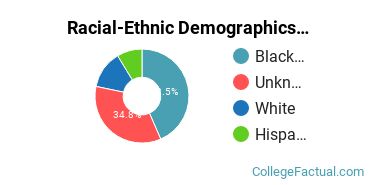
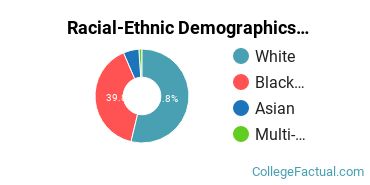
UOPX - Virginia Racial/Ethnic Breakdown of Undergraduates
| Race/Ethnicity | Number |
|---|---|
| Black or African American | 10 |
| Unknown | 8 |
| White | 3 |
| Hispanic | 2 |
| Asian | 0 |
| Native Hawaiian or Pacific Islander | 0 |
| International | 0 |
| Multi-Ethnic | 0 |
See racial/ethnic breakdown for all students.
UOPX - Virginia Graduate Student Population
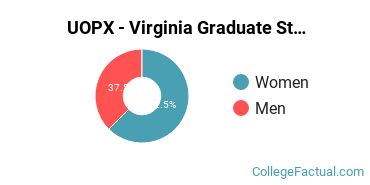
Male/Female Breakdown of Graduate Students
About 63% of full-time grad students are women, and 38% men.
For the gender breakdown for all students, go here.
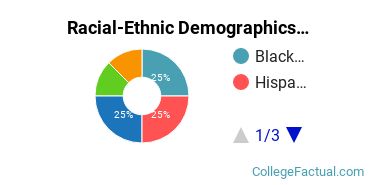
UOPX - Virginia Racial-Ethnic Breakdown of Graduate Students
| Race/Ethnicity | Number |
|---|---|
| Black or African American | 2 |
| Hispanic | 2 |
| Unknown | 2 |
| White | 1 |
| Native Hawaiian or Pacific Islander | 1 |
| Asian | 0 |
| International | 0 |
| Multi-Ethnic | 0 |
See racial/ethnic breakdown for all students.

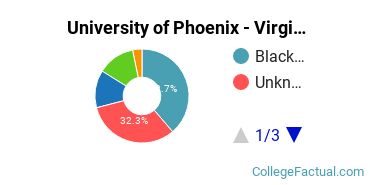
Above Average when it Comes to Racial/Ethnic Diversity
UOPX - Virginia is ranked 659 out of 3,790 when it comes to the racial/ethnic diversity of the students.
High racial/ethnic diversity in the student body means plenty of opportunities to interact with and learn from students with different backgrounds and cultures than you.
UOPX - Virginia Racial Demographics:
| Race/Ethnicity | Number |
|---|---|
| Black or African American | 12 |
| Unknown | 10 |
| Hispanic | 4 |
| White | 4 |
| Native Hawaiian or Pacific Islander | 1 |
| Asian | 0 |
| International | 0 |
| Multi-Ethnic | 0 |
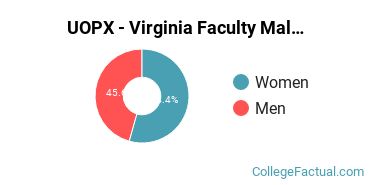
High Racial/Ethnic Diversity Among Faculty
University of Phoenix - Virginia Faculty Racial/Ethnic Demographics:
| Ethnicity | Number of Faculty |
|---|---|
| White | 50 |
| Black or African American | 37 |
| Asian | 5 |
| Multi-Ethnic | 1 |
| Hispanic | 0 |
| Native Hawaiian or Pacific Islander | 0 |
| International | 0 |
| Unknown | 0 |
Learn more about the faculty at UOPX - Virginia.
Average Male/Female Ratio
UOPX - Virginia ranks 2,800 out of 3,790 when it comes to gender parity on campus.
This school is more popular with men than with women.
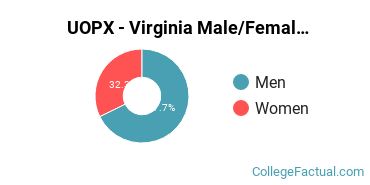
There are approximately 10 female students and 21 male students at UOPX - Virginia.
Even Balance of Male & Female Teachers
Reporting of the gender of UOPX - Virginia is unknown or unavailable.
There are more female teachers than male teachers at this school.
More about UOPX - Virginia faculty.
There are approximately 56 female teachers and 47 male teachers.
High Student Age Diversity
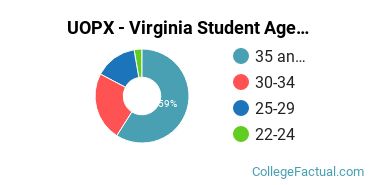
| Student Age Group | Amount |
|---|---|
| 35 and over | 174 |
| 30-34 | 70 |
| 25-29 | 43 |
| 22-24 | 8 |
| 18-19 | 0 |
| 20-21 | 0 |
| Under 18 | 0 |
Notes and References
Footnotes
*The racial-ethnic minorities count is calculated by taking the total number of students and subtracting white students, international students, and students whose race/ethnicity was unknown. This number is then divided by the total number of students at the school to obtain the racial-ethnic minorities percentage.
References
College Factual provides higher-education, college and university, degree, program, career, salary, and other helpful information to students, faculty, institutions, and other internet audiences. Presented information and data are subject to change. Inclusion on this website does not imply or represent a direct relationship with the company, school, or brand. Information, though believed correct at time of publication, may not be correct, and no warranty is provided. Contact the schools to verify any information before relying on it. Financial aid may be available for those who qualify. The displayed options may include sponsored or recommended results, not necessarily based on your preferences.
© College Factual – All Rights Reserved.