Lincoln Memorial University Doctorate in Veterinary Medicine
Veterinary Medicine is a concentration offered under the veterinary medicine major at Lincoln Memorial University. Here, you’ll find out more about the major doctor’s degree program in veterinary medicine, including such details as the number of graduates, diversity of students, and more.
You can jump to any section of this page using the links below:
Featured schools near , edit
Rankings for the LMU Doctorate in Veterinary Medicine
If you're having trouble deciding which school is a good match for you, you may want to check out College Factual's Best Veterinary Medicine Doctor's Degree Schools ranking to see some of the great options that are available. To determine the school's rank, we look at objective measures, such as post-graduation earnings, student and faculty diversity, and accumulated student debt.
On the 2021 list, LMU was ranked #458 out of 464 schools in the country for this major at the doctorate level. It is also ranked #11 in Tennessee.
How Much Does a Doctorate in Veterinary Medicine from LMU Cost?
LMU Graduate Tuition and Fees
During the 2018-2019 academic year, part-time graduate students at LMU paid an average of $0 per credit hour. No discount was available for in-state students. The following table shows the average full-time tuition and fees for graduate student.
| In State | Out of State | |
|---|---|---|
| Tuition | $18,093 | $18,093 |
| Fees | $30 | $30 |
Does LMU Offer an Online Doctorate in Veterinary Medicine?
LMU does not offer an online option for its veterinary medicine doctor’s degree program at this time. To see if the school offers distance learning options in other areas, visit the LMU Online Learning page.

LMU Doctorate Student Diversity for Veterinary Medicine
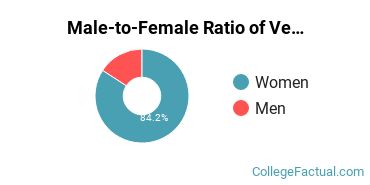
Male-to-Female Ratio
About 84.2% of the students who received their Doctorate in veterinary medicine in 2018-2019 were women. This is higher than the nationwide number of 80.7%.
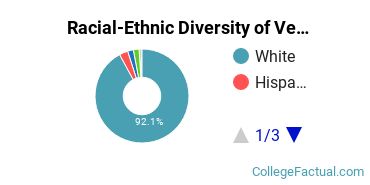
Racial-Ethnic Diversity
Of those graduates who received a doctor’s degree in veterinary medicine at LMU in 2018-2019, 5.9% were racial-ethnic minorities*. This is lower than the nationwide number of 16%.
| Race/Ethnicity | Number of Students |
|---|---|
| Asian | 2 |
| Black or African American | 0 |
| Hispanic or Latino | 3 |
| Native American or Alaska Native | 1 |
| Native Hawaiian or Pacific Islander | 0 |
| White | 93 |
| International Students | 0 |
| Other Races/Ethnicities | 2 |
References
*The racial-ethnic minorities count is calculated by taking the total number of students and subtracting white students, international students, and students whose race/ethnicity was unknown. This number is then divided by the total number of students at the school to obtain the racial-ethnic minorities percentage.
More about our data sources and methodologies.
Featured Schools
College Factual provides higher-education, college and university, degree, program, career, salary, and other helpful information to students, faculty, institutions, and other internet audiences. Presented information and data are subject to change. Inclusion on this website does not imply or represent a direct relationship with the company, school, or brand. Information, though believed correct at time of publication, may not be correct, and no warranty is provided. Contact the schools to verify any information before relying on it. Financial aid may be available for those who qualify. The displayed options may include sponsored or recommended results, not necessarily based on your preferences.
© College Factual – All Rights Reserved.