Pennsylvania State University - Harrisburg MS in Information Science
The main focus area for this major is General Information Science. For more details on this concentration, visit its profile page.
Information Science is a major offered under the computer and information sciences program of study at Pennsylvania State University - Harrisburg. Here, you’ll find out more about the major master’s degree program in IS, including such details as the number of graduates, ethnicity of students, related majors and concentrations, and more.
If there’s something special you’re looking for, you can use one of the links below to find it:
- Master’s Degree Rankings
- Graduate Cost
- Student Debt
- Average Salary
- Online Learning
- Student Diversity
- Related Majors
- Focus Areas
- References
Featured schools near , edit
Rankings for the Penn State Harrisburg MS in IS
Each year, College Factual produces its Best Information Science Master's Degree Schools ranking to help students decide which school is the best fit for them. This ranking takes a number of things into account when determining a school's overall quality. Ranking factors include student and faculty diversity, average graduate earnings, and average amount of student debt.
On the 2021 list, Penn State Harrisburg was ranked #188 out of 782 schools in the country for this major at the master's level. It is also ranked #12 in Pennsylvania.
How Much Does a Master’s in IS from Penn State Harrisburg Cost?
Penn State Harrisburg Graduate Tuition and Fees
Out-of-state part-time graduates at Penn State Harrisburg paid an average of $1,197 per credit hour in 2018-2019. The average for in-state students was $908 per credit hour. The average full-time tuition and fees for graduate students are shown in the table below.
| In State | Out of State | |
|---|---|---|
| Tuition | $21,792 | $28,718 |
| Fees | $992 | $992 |
Penn State Harrisburg IS MS Student Debt
One factor in determining the overall cost in a degree is to consider how much in student loans you’ll have to take out. Students who received their master’s degree at Penn State Harrisburg in IS walked away with an average of $40,949 in student debt. That is 14% lower than the national average of $47,585.

How Much Can You Make With a MS in IS From Penn State Harrisburg?
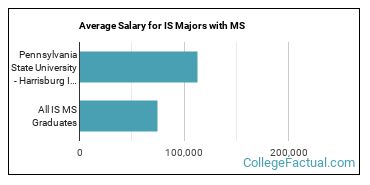
IS who receive their master’s degree from Penn State Harrisburg make an average of $113,000 a year during the early days of their career. That is 52% higher than the national average of $74,358.
Does Penn State Harrisburg Offer an Online MS in IS?
Online degrees for the Penn State Harrisburg IS master’s degree program are not available at this time. To see if the school offers distance learning options in other areas, visit the Penn State Harrisburg Online Learning page.

Penn State Harrisburg Master’s Student Diversity for IS
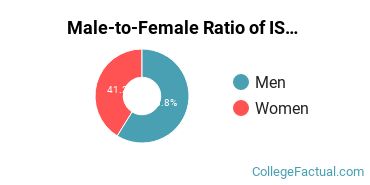
Male-to-Female Ratio
Of the students who received their master’s degree in IS in 2018-2019, 41.2% of them were women. This is in the same ballpark of the nationwide number of 42.3%.
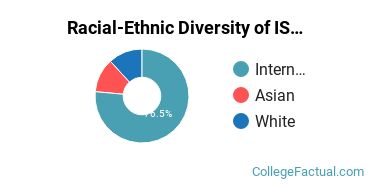
Racial-Ethnic Diversity
Racial-ethnic minority graduates* made up 11.8% of the IS master’s degrees at Penn State Harrisburg in 2018-2019. This is lower than the nationwide number of 24%.
| Race/Ethnicity | Number of Students |
|---|---|
| Asian | 2 |
| Black or African American | 0 |
| Hispanic or Latino | 0 |
| Native American or Alaska Native | 0 |
| Native Hawaiian or Pacific Islander | 0 |
| White | 2 |
| International Students | 13 |
| Other Races/Ethnicities | 0 |
MS in IS Focus Areas at Penn State Harrisburg
Information Science students may decide to major in one of the following focus areas.
| Focus Area | Annual Graduates |
|---|---|
| General Information Science | 17 |
Majors Related to a MS in IS From Penn State Harrisburg
You may also be interested in one of these majors related to information science.
| Related Major | Annual Graduates |
|---|---|
| Computer Information Systems | 17 |
View All Information Science Related Majors >
References
*The racial-ethnic minorities count is calculated by taking the total number of students and subtracting white students, international students, and students whose race/ethnicity was unknown. This number is then divided by the total number of students at the school to obtain the racial-ethnic minorities percentage.
More about our data sources and methodologies.
Featured Schools
College Factual provides higher-education, college and university, degree, program, career, salary, and other helpful information to students, faculty, institutions, and other internet audiences. Presented information and data are subject to change. Inclusion on this website does not imply or represent a direct relationship with the company, school, or brand. Information, though believed correct at time of publication, may not be correct, and no warranty is provided. Contact the schools to verify any information before relying on it. Financial aid may be available for those who qualify. The displayed options may include sponsored or recommended results, not necessarily based on your preferences.
© College Factual – All Rights Reserved.