We've pulled together some essential information you should know about the program, including how many students graduate each year, the ethnic diversity of these students, and more. In addition, we cover how Boston U ranks in comparison to other schools with medical prep programs.
Go directly to any of the following sections:
In College Factual's most recent rankings for the best schools for medical prep majors, Boston U came in at #7. This puts it in the top 5% of the country in this field of study. It is also ranked #2 in Massachusetts.
During the 2020-2021 academic year, Boston University handed out 19 bachelor's degrees in health/medical prep programs. This is a decrease of 17% over the previous year when 23 degrees were handed out.
In 2021, 38 students received their master’s degree in medical prep from Boston U. This makes it the #3 most popular school for medical prep master’s degree candidates in the country.
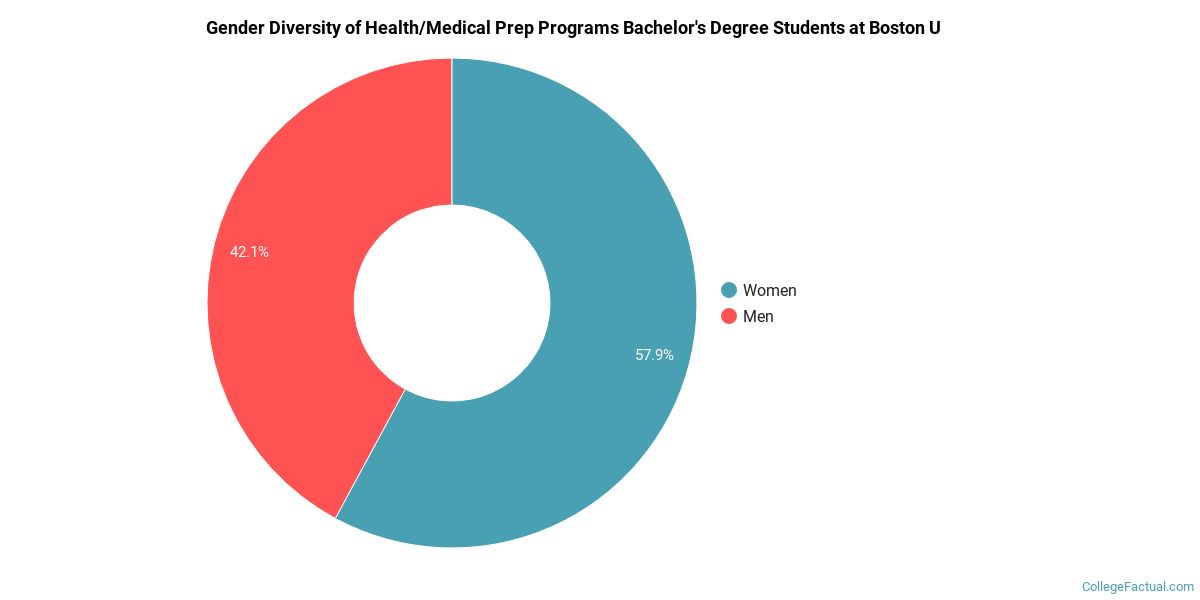
Take a look at the following statistics related to the make-up of the medical prep majors at Boston University.
Of the 19 students who earned a bachelor's degree in Health/Medical Prep Programs from Boston U in 2020-2021, 42% were men and 58% were women.
The majority of the graduates for this major are Asian American. In the graduating class of 2021, 74% of grads fell into this category.
The following table and chart show the ethnic background for students who recently graduated from Boston University with a bachelor's in medical prep.

| Ethnic Background | Number of Students |
|---|---|
| Asian | 14 |
| Black or African American | 0 |
| Hispanic or Latino | 1 |
| White | 2 |
| Non-Resident Aliens | 0 |
| Other Races | 2 |
Of the 38 students who earned a master's degree in Health/Medical Prep Programs from Boston U in 2020-2021, 45% were men and 55% were women.

The following table and chart show the ethnic background for students who recently graduated from Boston University with a master's in medical prep.

| Ethnic Background | Number of Students |
|---|---|
| Asian | 9 |
| Black or African American | 4 |
| Hispanic or Latino | 7 |
| White | 12 |
| Non-Resident Aliens | 0 |
| Other Races | 6 |
| Related Major | Annual Graduates |
|---|---|
| Public Health | 246 |
| Health Sciences & Services | 212 |
| Rehabilitation & Therapeutic Professions | 205 |
| Dentistry | 196 |
| Medicine | 167 |
More about our data sources and methodologies.