JFKU Demographics & Diversity Report
Many schools pride themselves on their diversity, but what does that mean, really? College Factual ran the numbers to find out how diverse the average college campus really is, taking into account race, gender, the ages of the students, and where they're from. Keep reading the JFKU diversity report to see how they stack up against the average.Featured schools near , edit
JFKU Student Population
How Many Students Attend John F. Kennedy University?
JFKU total enrollment is approximately 1,125 students.
24 are undergraduates and 340 are graduate students.
JFKU Undergraduate Population
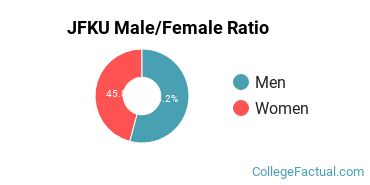
Male/Female Breakdown of Undergraduates
The full-time JFKU undergraduate population is made up of 46% women, and 54% men.
For the gender breakdown for all students, go here.
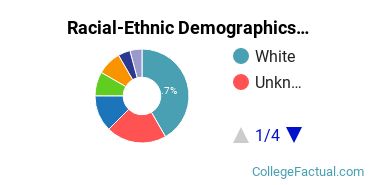
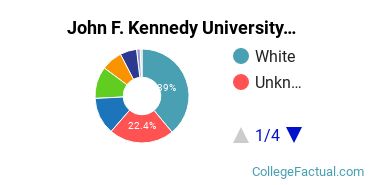
JFKU Racial/Ethnic Breakdown of Undergraduates
| Race/Ethnicity | Number |
|---|---|
| White | 10 |
| Unknown | 5 |
| Hispanic | 3 |
| Multi-Ethnic | 2 |
| Black or African American | 2 |
| International | 1 |
| Asian | 1 |
| Native Hawaiian or Pacific Islander | 0 |
See racial/ethnic breakdown for all students.
JFKU Graduate Student Population
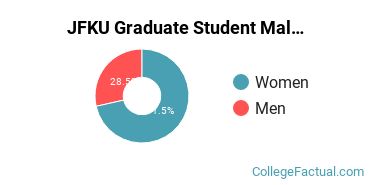
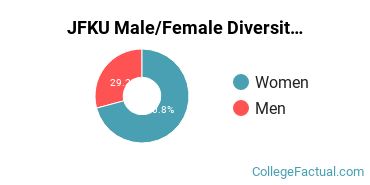
Male/Female Breakdown of Graduate Students
About 71% of full-time grad students are women, and 29% men.
For the gender breakdown for all students, go here.
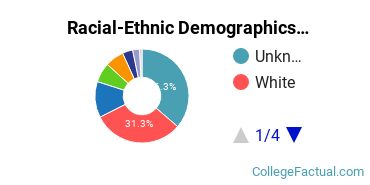
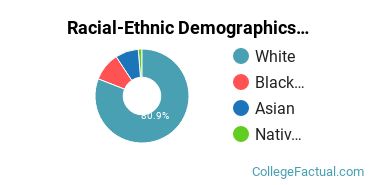
JFKU Racial-Ethnic Breakdown of Graduate Students
| Race/Ethnicity | Number |
|---|---|
| Unknown | 123 |
| White | 106 |
| Hispanic | 42 |
| Asian | 23 |
| Black or African American | 22 |
| Multi-Ethnic | 12 |
| International | 8 |
| Native Hawaiian or Pacific Islander | 3 |
See racial/ethnic breakdown for all students.

Extremely Racially/Ethnically Diverse
JFKU is ranked 60 out of 3,790 when it comes to the racial/ethnic diversity of the students.
High racial/ethnic diversity in the student body means plenty of opportunities to interact with and learn from students with different backgrounds and cultures than you.
JFKU Racial Demographics:
| Race/Ethnicity | Number |
|---|---|
| White | 436 |
| Unknown | 251 |
| Black or African American | 143 |
| Hispanic | 123 |
| Multi-Ethnic | 81 |
| Asian | 64 |
| International | 14 |
| Native Hawaiian or Pacific Islander | 7 |
High Racial/Ethnic Diversity Among Faculty
John F. Kennedy University Faculty Racial/Ethnic Demographics:
| Ethnicity | Number of Faculty |
|---|---|
| White | 314 |
| Black or African American | 38 |
| Asian | 31 |
| Native Hawaiian or Pacific Islander | 5 |
| Hispanic | 0 |
| International | 0 |
| Multi-Ethnic | 0 |
| Unknown | 0 |
Learn more about the faculty at JFKU.
Average Male/Female Ratio
JFKU ranks 1,888 out of 3,790 when it comes to gender parity on campus.
This school is more popular with women than with men.
There are approximately 797 female students and 328 male students at JFKU.
Slightly Unbalanced Ratio of Male & Female Teachers
Reporting of the gender of JFKU is unknown or unavailable.
There are more female teachers than male teachers at this school.
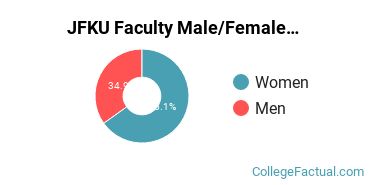
There are approximately 325 female teachers and 174 male teachers.
International Students at JFKU
Students from 24 countries are represented at this school, with the majority of the international students coming from India, Saudi Arabia, and Canada.
Learn more about international students at JFKU.
High Student Age Diversity
A traditional college student is defined as being between the ages of 18-21. At JFKU, 0.61% of students fall into that category, compared to the national average of 60%.
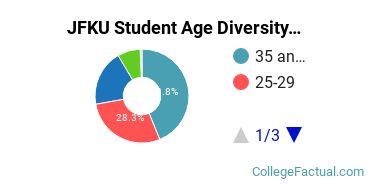
| Student Age Group | Amount |
|---|---|
| 35 and over | 351 |
| 25-29 | 227 |
| 30-34 | 155 |
| 22-24 | 63 |
| 20-21 | 5 |
| 18-19 | 0 |
| Under 18 | 0 |
Notes and References
Footnotes
*The racial-ethnic minorities count is calculated by taking the total number of students and subtracting white students, international students, and students whose race/ethnicity was unknown. This number is then divided by the total number of students at the school to obtain the racial-ethnic minorities percentage.
References
-
Department of Homeland Security Citizenship and Immigration Services
-
Image Credit: By User KAKM on en.wikipedia under License
College Factual provides higher-education, college and university, degree, program, career, salary, and other helpful information to students, faculty, institutions, and other internet audiences. Presented information and data are subject to change. Inclusion on this website does not imply or represent a direct relationship with the company, school, or brand. Information, though believed correct at time of publication, may not be correct, and no warranty is provided. Contact the schools to verify any information before relying on it. Financial aid may be available for those who qualify. The displayed options may include sponsored or recommended results, not necessarily based on your preferences.
© College Factual – All Rights Reserved.