UAGC Demographics & Diversity Report
UAGC Student Population
How Many Students Attend The University of Arizona Global Campus?
UAGC total enrollment is approximately 31,115 students. 25,425 are undergraduates and 5,690 are graduate students.
UAGC Undergraduate Population
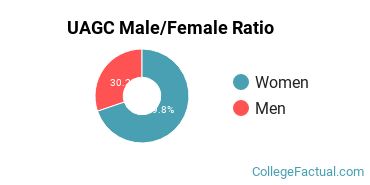
Male/Female Breakdown of Undergraduates
The full-time UAGC undergraduate population is made up of 68% women, and 32% men.
For the gender breakdown for all students, go here.
UAGC Racial/Ethnic Breakdown of Undergraduates
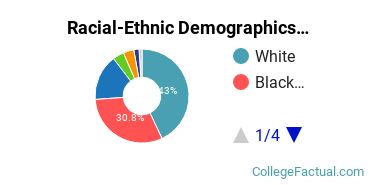
| Race/Ethnicity | Number |
|---|---|
| White | 10,877 |
| Black or African American | 7,326 |
| Hispanic | 4,620 |
| Multi-Ethnic | 1,009 |
| Unknown | 610 |
| Asian | 550 |
| Native Hawaiian or Pacific Islander | 239 |
| International | 28 |
See racial/ethnic breakdown for all students.
UAGC Graduate Student Population
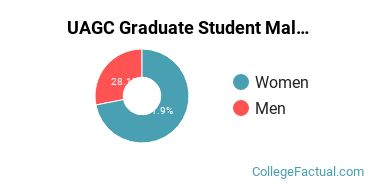
Male/Female Breakdown of Graduate Students
About 71% of full-time grad students are women, and 29% men.
For the gender breakdown for all students, go here.
UAGC Racial-Ethnic Breakdown of Graduate Students
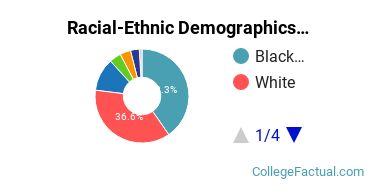
| Race/Ethnicity | Number |
|---|---|
| White | 2,184 |
| Black or African American | 2,076 |
| Hispanic | 762 |
| Asian | 228 |
| Multi-Ethnic | 205 |
| Unknown | 125 |
| Native Hawaiian or Pacific Islander | 46 |
| International | 14 |
See racial/ethnic breakdown for all students.
Racial/Ethnic Diversity
UAGC Racial Demographics:
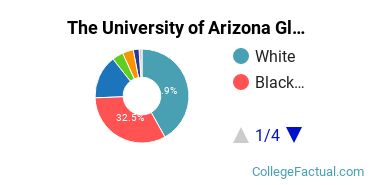
| Race/Ethnicity | Number |
|---|---|
| White | 13,061 |
| Black or African American | 9,402 |
| Hispanic | 5,382 |
| Multi-Ethnic | 1,214 |
| Asian | 778 |
| Unknown | 735 |
| Native Hawaiian or Pacific Islander | 285 |
| International | 42 |
UAGC Male/Female Diversity
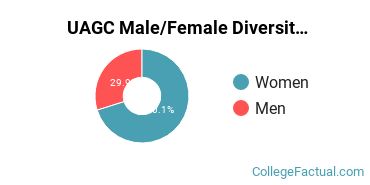
There are approximately 21,324 female students and 9,791 male students at UAGC.
International Students at UAGC
Students from 10 countries are represented at this school, with the majority of the international students coming from Germany, Ghana, and Dominican Republic.
Learn more about international students at UAGC.
High Student Age Diversity
A traditional college student is defined as being between the ages of 18-21. At UAGC, 3.12% of students fall into that category, compared to the national average of 60%.
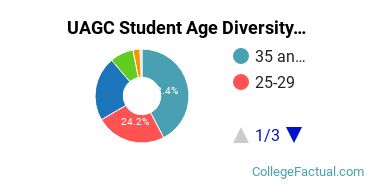
| Student Age Group | Amount |
|---|---|
| 35 and over | 15,401 |
| 25-29 | 8,779 |
| 30-34 | 8,075 |
| 22-24 | 2,938 |
| 20-21 | 874 |
| 18-19 | 265 |
| Under 18 | 0 |
Notes and References
Footnotes
*The racial-ethnic minorities count is calculated by taking the total number of students and subtracting white students, international students, and students whose race/ethnicity was unknown. This number is then divided by the total number of students at the school to obtain the racial-ethnic minorities percentage.
References
-
Department of Homeland Security Citizenship and Immigration Services
-
Learn more about how College Factual creates their Diversity Rankings.
College Factual provides higher-education, college and university, degree, program, career, salary, and other helpful information to students, faculty, institutions, and other internet audiences. Presented information and data are subject to change. Inclusion on this website does not imply or represent a direct relationship with the company, school, or brand. Information, though believed correct at time of publication, may not be correct, and no warranty is provided. Contact the schools to verify any information before relying on it. Financial aid may be available for those who qualify. The displayed options may include sponsored or recommended results, not necessarily based on your preferences.
© College Factual – All Rights Reserved.