A T Still University of Health Sciences total enrollment is approximately 3,995 students.
See racial/ethnic breakdown for all students.
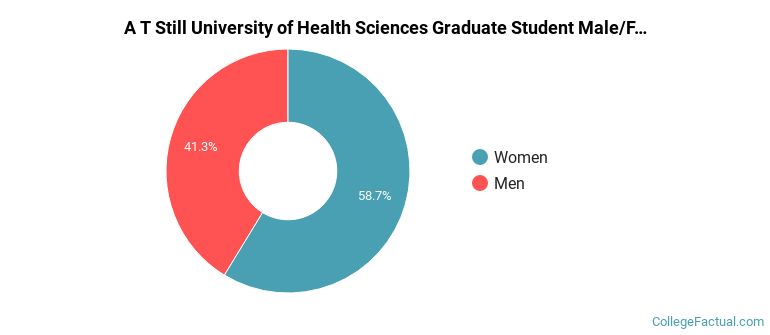
Male/Female Breakdown of Graduate Students
About 59% of full-time grad students are women, and 41% men.
For the gender breakdown for all students, go here.
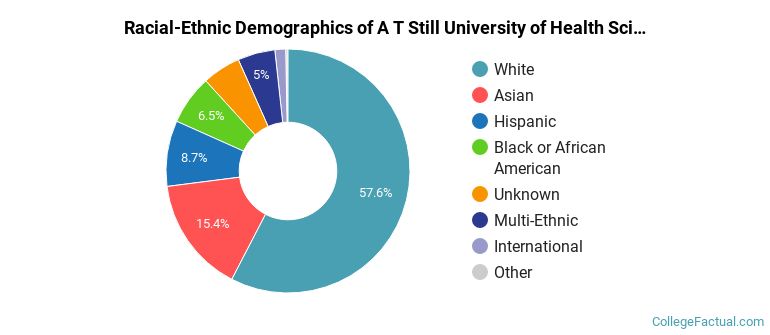
A T Still University of Health Sciences Racial-Ethnic Breakdown of Graduate Students
| Race/Ethnicity | Number |
|---|---|
| White | 1,685 |
| Asian | 467 |
| Hispanic | 299 |
| Black or African American | 179 |
| Multi-Ethnic | 156 |
| Unknown | 151 |
| International | 53 |
| Native Hawaiian or Pacific Islander | 9 |
See racial/ethnic breakdown for all students.
| Race/Ethnicity | Number |
|---|---|
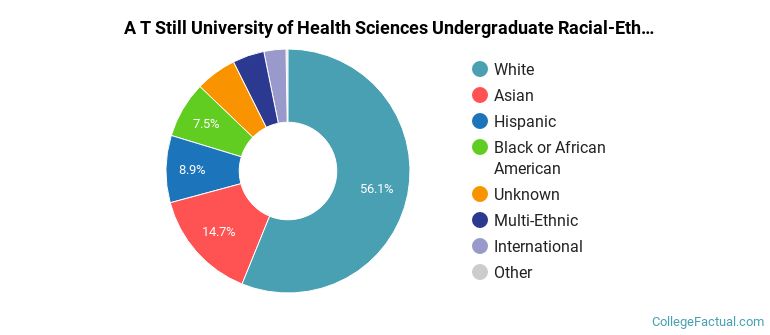
| White | 2,161 |
| Asian | 600 |
| Hispanic | 395 |
| Black or African American | 289 |
| Unknown | 206 |
| Multi-Ethnic | 185 |
| International | 123 |
| Native Hawaiian or Pacific Islander | 13 |
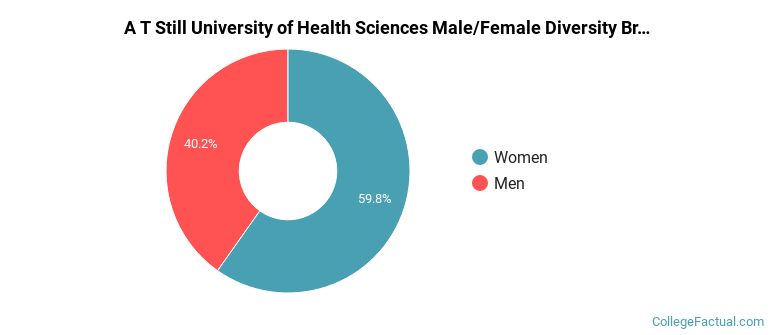
There are approximately 2,396 female students and 1,599 male students at A T Still University of Health Sciences.
A traditional college student is defined as being between the ages of 18-21. At A T Still University of Health Sciences, 0.21% of students fall into that category, compared to the national average of 60%.
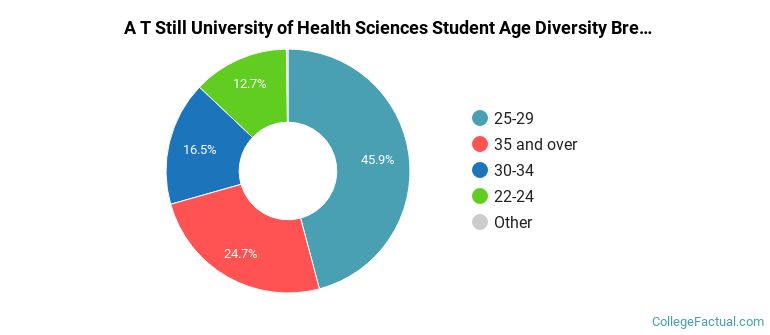
| Student Age Group | Amount |
|---|---|
| 25-29 | 1,686 |
| 35 and over | 910 |
| 30-34 | 605 |
| 22-24 | 468 |
| 20-21 | 8 |
| 18-19 | 0 |
| Under 18 | 0 |
Footnotes
*The racial-ethnic minorities count is calculated by taking the total number of students and subtracting white students, international students, and students whose race/ethnicity was unknown. This number is then divided by the total number of students at the school to obtain the racial-ethnic minorities percentage.
References
Department of Homeland Security Citizenship and Immigration Services
Read College Factual's Diversity Ranking Methodology.