Explore the best ranked schools for the programs you are most interested in.
Alaska Christian College was not ranked in College Factual's Best Overall Colleges report this year. This may be because not enough data was available.
At Alaska Christian College, the student to faculty ratio is an excellent 6 to 1. That's much better than the national average of 15 to 1. This indicates that many classes will probably be small, and students will have ample opportunites to work closely with their professors and classmates.
The freshmen retention rate tells us what percentage of first-year, full-time students choose to continue on to their sophomore year at a particular school. The rate at Alaska Christian College is 63%, which is about average when compared to the national rate of 68%.
During the 2017-2018 academic year, there were 93 undergraduates at Alaska Christian College with 85 being full-time and 8 being part-time.
The net price is calculated by adding tuition, room, board and other costs and subtracting financial aid.Note that the net price is typically less than the published for a school. For more information on the sticker price of Alaska Christian College, see our tuition and fees and room and board pages.
The student loan default rate at Alaska Christian College is 7.0%. Although this is lower than the national default rate of 10.1%, you'll still want to keep this in mind when taking out student loans.
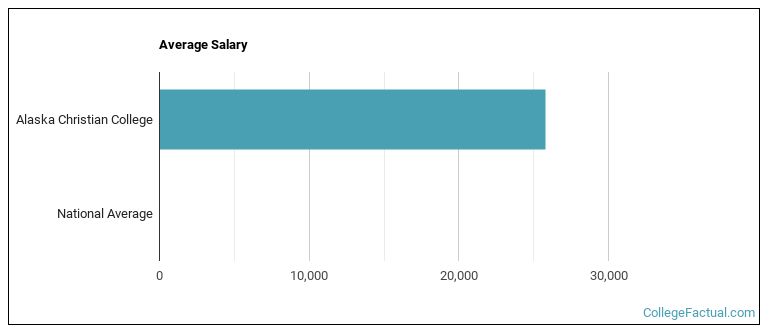
See which majors at Alaska Christian College make the most money.
Get more details about the location of Alaska Christian College.

Contact details for Alaska Christian College are given below.
| Contact Details | |
|---|---|
| Address: | 35109 Royal Place, Soldotna, AK 99669 |
| Phone: | 907-260-7422 |
| Website: | www.alaskacc.edu/ |
| Most Popular Majors | Bachelor’s Degrees | Average Salary of Graduates |
|---|---|---|
| Theological & Ministerial Studies | 3 | NA |
| Teaching Assistants | 2 | NA |
| Public Health | 2 | NA |
| Liberal Arts General Studies | 2 | NA |
Footnotes
*The racial-ethnic minorities count is calculated by taking the total number of students and subtracting white students, international students, and students whose race/ethnicity was unknown. This number is then divided by the total number of students at the school to obtain the racial-ethnic minorities percentage.
References
More about our data sources and methodologies.