College Factual  by our College Data Analytics Team
       Unbiased Factual Guarantee

All-State Career - Baltimore Data & Information Overview

This overview covers the essential stats on All-State Career - Baltimore, including its rankings, majors, diversity, and more. If you’re interested in learning more about a particular stat, just click on its tile to go to a new page that covers the topic more in-depth. Also, you can jump to any section of this page by clicking one of the links below.

How Well Is All-State Career - Baltimore Ranked?

2025 Rankings

Explore Best Ranked Schools for You

Explore the best ranked schools for the programs you are most interested in.

Overall Quality

All-State Career - Baltimore was not ranked in College Factual's Best Overall Colleges report this year. This may be because not enough data was available.

See all of the rankings for All-State Career - Baltimore.

Is It Hard to Get Into All-State Career - Baltimore?

Open Admissions Policy

Acceptance Rate

All-State Career - Baltimore has an open admissions policy, so you should not have much trouble being accepted by the school. Still, it is important to fill out the application completely and submit any requested materials, which may include proof that you have a high school diploma or the equivalent.

Learn more about All-State Career - Baltimore admissions.

All-State Career - Baltimore Faculty

21 to 1 Student to Faculty

Student to Faculty Ratio

At All-State Career - Baltimore, the student to faculty ratio is 21 to 1. Compared to the national average of 15 to 1, this is somewhat high. This could mean that class sizes may be larger than they are at other colleges or universities or that professors may be required to teach more classes.

Retention and Graduation Rates at All-State Career - Baltimore

53% Freshmen Retention

Freshmen Retention Rate

The freshmen retention rate is a sign of how many full-time students like a college or university well enough to come back for their sophomore year. At All-State Career - Baltimore this rate is 53%, which is a bit lower than the national average of 68%.

Freshmen Retention Rate  53 out of 100
0
100

Find out more about the retention and graduation rates at All-State Career - Baltimore.

All-State Career - Baltimore Undergraduate Student Diversity

525 Full-Time Undergraduates
73.5% Racial-Ethnic Minorities*
48.6% Percent Women

During the 2017-2018 academic year, there were 525 full-time undergraduates at All-State Career - Baltimore.

How Much Does All-State Career - Baltimore Cost?

$20,277 Net Price
68% Take Out Loans
$25,172 Total Student Loans
The overall average net price of All-State Career - Baltimore is $20,277. The affordability of the school largely depends on your financial need since net price varies by income group. See the table below for the net price for different income groups.

Net Price by Income Group for All-State Career - Baltimore

$0-30 K$30K-48K$48-75$75-110K$110K +
$20,226$19,800$21,321$22,383$23,431

The net price is calculated by adding tuition, room, board and other costs and subtracting financial aid.Note that the net price is typically less than the published for a school. For more information on the sticker price of All-State Career - Baltimore, see our tuition and fees and room and board pages.

Student Loan Debt

While almost two-thirds of students nationwide take out loans to pay for college, the percentage may be quite different for the school you plan on attending. At All-State Career - Baltimore, approximately 68% of students took out student loans averaging $6,293 a year. That adds up to $25,172 over four years for those students.

Get more details about paying for All-State Career - Baltimore.

How Much Money Do All-State Career - Baltimore Graduates Make?

$33,193 Avg Salary of Grads
High Earnings Boost
Although some majors pay more than others, students who graduate from All-State Career - Baltimore with a bachelor's degree go on to jobs where they make an average salary of $33,193 in their early years. Unfortunately, this is 33% less that the average college graduate's salary of $49,219 per year. However, graduates in your major field may make more.

undefined

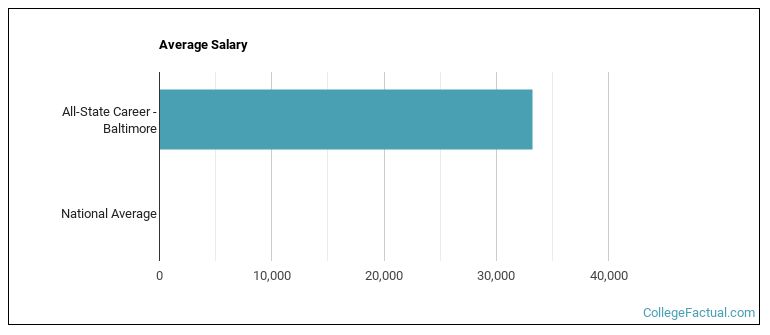
See which majors at All-State Career - Baltimore make the most money.

Location of All-State Career - Baltimore

Maryland State
525 Full-Time Undergraduates
Large City Campus Setting
All-State Career - Baltimore is a private for-profit institution situated in Baltimore, Maryland. The city atmosphere of Baltimore makes it a great place for students who enjoy having lots of educational and entertainment options.

Get more details about the location of All-State Career - Baltimore.

undefined

Contact details for All-State Career - Baltimore are given below.

Contact Details
Address:2200 Broening Hwy Ste 160, Baltimore, MD 21224
Phone:410-631-1818
Website:https://www.allstatecareer.edu/

All-State Career - Baltimore Majors

6 Majors With Completions
1,122 Undergraduate Degrees
1,122 Graduate Degrees
During the most recent year for which we have data, students from 6 majors graduated from All-State Career - Baltimore. Of these students, 1,122 received undergraduate degrees and 1,122 graduated with a master's or doctor's degree. The following table lists the most popular undergraduate majors along with the average salary graduates from those majors make.

Most Popular MajorsBachelor’s DegreesAverage Salary of Graduates
Dental Support Services222NA
Ground Transportation222NA
Allied Health & Medical Assisting Services68NA
Health & Medical Administrative Services23NA
Heating, Air Conditioning, Ventilation & Refrigeration23NA
Business Support & Assistant Services3NA

Learn more about the majors offered at All-State Career - Baltimore along with which ones have the highest average starting salaries.

Learn more about online learning at All-State Career - Baltimore.

Notes and References

Footnotes

*The racial-ethnic minorities count is calculated by taking the total number of students and subtracting white students, international students, and students whose race/ethnicity was unknown. This number is then divided by the total number of students at the school to obtain the racial-ethnic minorities percentage.

References

More about our data sources and methodologies.

Popular Reports

College Rankings
Best by Location
Degree Guides by Major
Graduate Programs

Compare Your School Options