College Factual  by our College Data Analytics Team
       Unbiased Factual Guarantee

All-State Career School - Pittsburgh Data & Information Overview

If you want to know more about All-State Career School - Pittsburgh, such as what majors does it offer, how diverse it is, how well it ranks, and more, this is your one-stop resource. Want to dig deeper into a particular stat? Just click on its tile and you’ll be taked to a more in-depth page on the figure. In addition, you can use the links below to quickly jump to any section on this page.

How Well Is All-State Career School - Pittsburgh Ranked?

2025 Rankings

Explore Best Ranked Schools for You

Explore the best ranked schools for the programs you are most interested in.

Overall Quality

All-State Career School - Pittsburgh was not ranked in College Factual's 2025 Best Overall Colleges report. This could be for a number of reasons, including lack of data.

See all of the rankings for All-State Career School - Pittsburgh.

Is It Hard to Get Into All-State Career School - Pittsburgh?

Open Admissions Policy

Acceptance Rate

Since All-State Career School - Pittsburgh has an open admissions policy, being accepted to the school isn't that hard. However, a full basic things - such as a high school diploma or equivalent - may be required. Also, go over your application to make sure it is complete before you submit it.

Learn more about All-State Career School - Pittsburgh admissions.

All-State Career School - Pittsburgh Faculty

12 to 1 Student to Faculty

Student to Faculty Ratio

The student to faculty ratio at All-State Career School - Pittsburgh is an impressive 12 to 1. That's quite good when you compare it to the national average of 15 to 1. This is a good sign that students at the school will have more opportunities for one-on-one interactions with their professors.

Retention and Graduation Rates at All-State Career School - Pittsburgh

79% Freshmen Retention

Freshmen Retention Rate

All-State Career School - Pittsburgh has a freshmen retention rate of 79%. That's a good sign that full-time students like the school and their professors enough to want to stick around for another year. It's also a sign that the admissions team did a good job in choosing applicants who were a good fit for the school.

Freshmen Retention Rate  79 out of 100
0
100

Find out more about the retention and graduation rates at All-State Career School - Pittsburgh.

All-State Career School - Pittsburgh Undergraduate Student Diversity

388 Full-Time Undergraduates
60.3% Racial-Ethnic Minorities*
9.0% Percent Women

During the 2017-2018 academic year, there were 388 full-time undergraduates at All-State Career School - Pittsburgh.

How Much Does All-State Career School - Pittsburgh Cost?

$15,129 Net Price
55% Take Out Loans
$26,912 Total Student Loans
The overall average net price of All-State Career School - Pittsburgh is $15,129. The affordability of the school largely depends on your financial need since net price varies by income group. See the table below for the net price for different income groups.

Net Price by Income Group for All-State Career School - Pittsburgh

$0-30 K$30K-48K$48-75$75-110K$110K +
$15,002$14,783$16,752$16,167$18,915

The net price is calculated by adding tuition, room, board and other costs and subtracting financial aid.Note that the net price is typically less than the published for a school. For more information on the sticker price of All-State Career School - Pittsburgh, see our tuition and fees and room and board pages.

Student Loan Debt

It's not uncommon for college students to take out loans to pay for school. In fact, almost 66% of students nationwide depend at least partially on loans. At All-State Career School - Pittsburgh, approximately 55% of students took out student loans averaging $6,728 a year. That adds up to $26,912 over four years for those students.

Get more details about paying for All-State Career School - Pittsburgh.

How Much Money Do All-State Career School - Pittsburgh Graduates Make?

$33,193 Avg Salary of Grads
High Earnings Boost
Yearly salaries vary depending on what you major in, but on average, bachelor's degree recipients from All-State Career School - Pittsburgh make around $33,193 per year during the early years of their employment. Unfortunately, this is 33% less that the average college graduate's salary of $49,219 per year. However, graduates in your major field may make more.

undefined

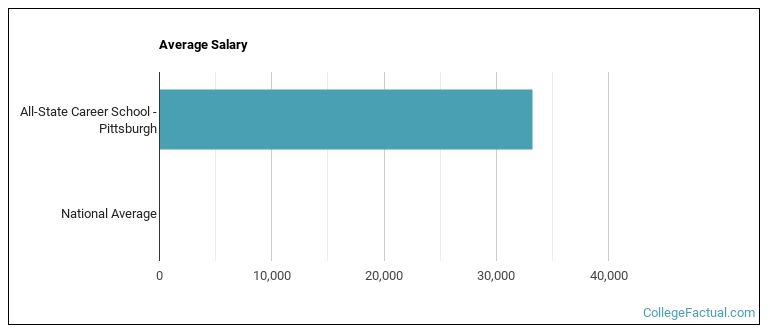
See which majors at All-State Career School - Pittsburgh make the most money.

Location of All-State Career School - Pittsburgh

Pennsylvania State
388 Full-Time Undergraduates
Suburb Campus Setting
All-State Career School - Pittsburgh is a private for-profit institution situated in West Mifflin, Pennsylvania. The suburban atmosphere of West Mifflin makes it a great place for students who want the amenities of city life without actually living in the middle of a constant hustle and bustle.

Get more details about the location of All-State Career School - Pittsburgh.

undefined

Contact details for All-State Career School - Pittsburgh are given below.

Contact Details
Address:1200 Lebanon Road, West Mifflin, PA 15122
Phone:412-823-1818
Website:https://www.allstatecareer.edu/

All-State Career School - Pittsburgh Majors

3 Majors With Completions
570 Undergraduate Degrees
570 Graduate Degrees
During the most recent year for which we have data, students from 3 majors graduated from All-State Career School - Pittsburgh. Of these students, 570 received undergraduate degrees and 570 graduated with a master's or doctor's degree. The following table lists the most popular undergraduate majors along with the average salary graduates from those majors make.

Most Popular MajorsBachelor’s DegreesAverage Salary of Graduates
Ground Transportation226NA
Heating, Air Conditioning, Ventilation & Refrigeration42NA
Precision Metal Working17NA

Learn more about the majors offered at All-State Career School - Pittsburgh along with which ones have the highest average starting salaries.

Learn more about online learning at All-State Career School - Pittsburgh.

Notes and References

Footnotes

*The racial-ethnic minorities count is calculated by taking the total number of students and subtracting white students, international students, and students whose race/ethnicity was unknown. This number is then divided by the total number of students at the school to obtain the racial-ethnic minorities percentage.

References

More about our data sources and methodologies.

Popular Reports

College Rankings
Best by Location
Degree Guides by Major
Graduate Programs

Compare Your School Options