AIC total enrollment is approximately 2,612 students. 1,281 are undergraduates and 1,102 are graduate students.
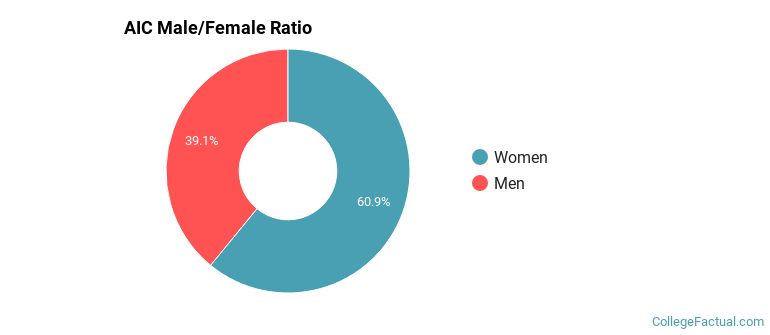
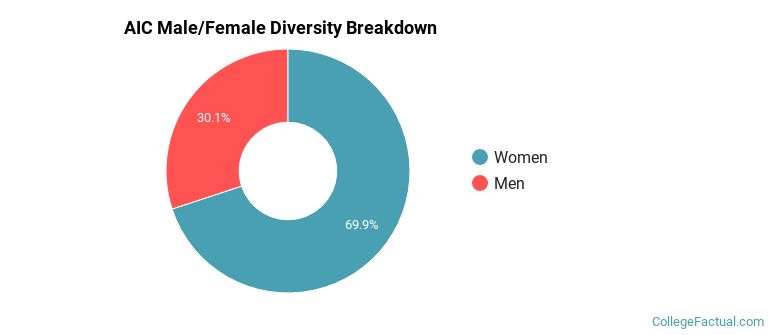
Male/Female Breakdown of Undergraduates
The full-time AIC undergraduate population is made up of 60% women, and 40% men.
For the gender breakdown for all students, go here.
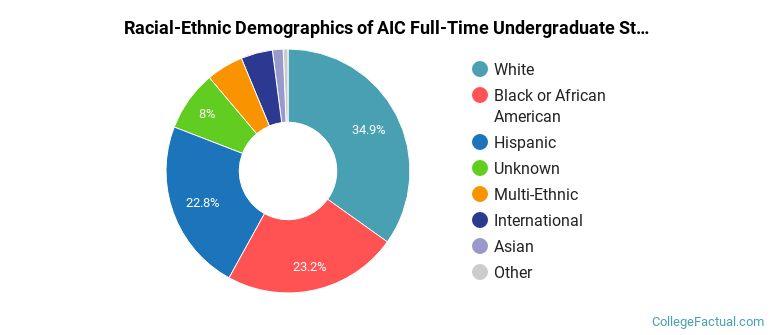
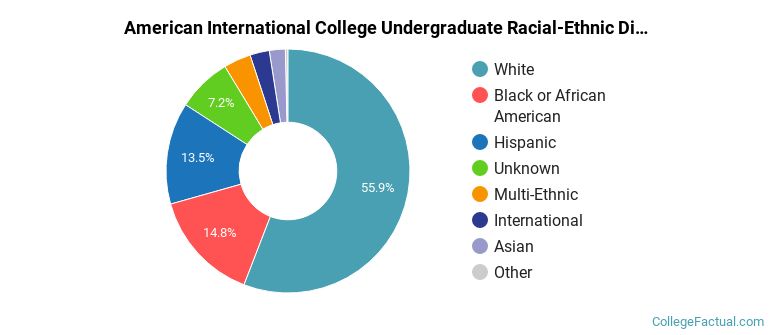
AIC Racial/Ethnic Breakdown of Undergraduates
| Race/Ethnicity | Number |
|---|---|
| White | 434 |
| Black or African American | 301 |
| Hispanic | 298 |
| Multi-Ethnic | 87 |
| Unknown | 71 |
| International | 48 |
| Asian | 21 |
| Native Hawaiian or Pacific Islander | 13 |
See racial/ethnic breakdown for all students.
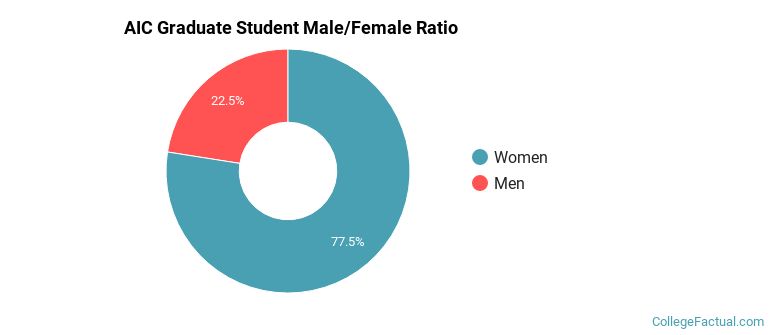
Male/Female Breakdown of Graduate Students
About 76% of full-time grad students are women, and 24% men.
For the gender breakdown for all students, go here.
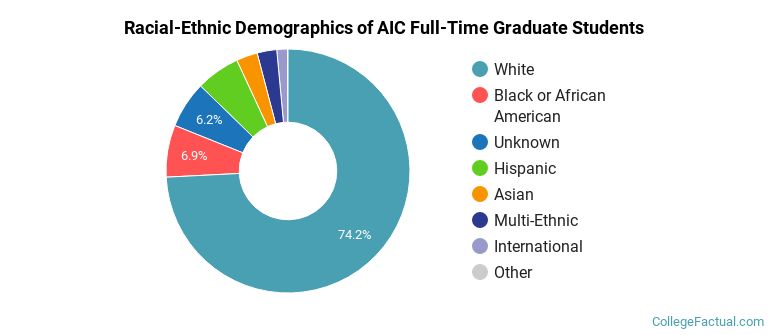
AIC Racial-Ethnic Breakdown of Graduate Students
| Race/Ethnicity | Number |
|---|---|
| White | 775 |
| Black or African American | 94 |
| Hispanic | 92 |
| Unknown | 56 |
| Multi-Ethnic | 36 |
| Asian | 31 |
| International | 16 |
| Native Hawaiian or Pacific Islander | 1 |
See racial/ethnic breakdown for all students.
| Race/Ethnicity | Number |
|---|---|
| White | 1,327 |
| Black or African American | 427 |
| Hispanic | 416 |
| Unknown | 169 |
| Multi-Ethnic | 129 |
| International | 65 |
| Asian | 56 |
| Native Hawaiian or Pacific Islander | 14 |
There are approximately 1,764 female students and 848 male students at AIC.
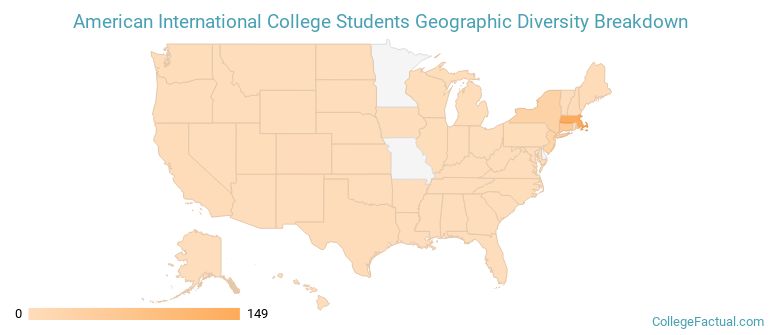
AIC ranks 651 out of 2,183 when it comes to geographic diversity.
49.49% of AIC students come from out of state, and 4.97% come from out of the country.
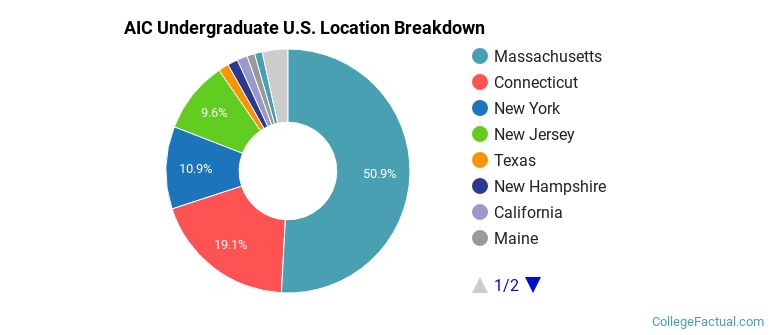
The undergraduate student body is split among 18 states (may include Washington D.C.). Click on the map for more detail.
| State | Amount |
|---|---|
| Massachusetts | 149 |
| Connecticut | 56 |
| New York | 32 |
| New Jersey | 28 |
| California | 4 |
Students from 31 countries are represented at this school, with the majority of the international students coming from Canada, United Kingdom, and Sweden.
Learn more about international students at AIC.
A traditional college student is defined as being between the ages of 18-21. At AIC, 27.81% of students fall into that category, compared to the national average of 60%.
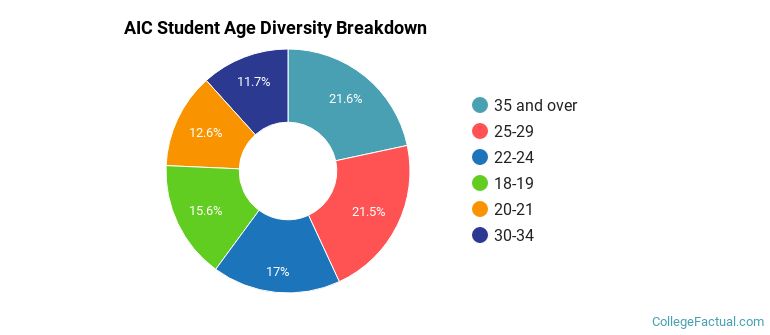
| Student Age Group | Amount |
|---|---|
| 35 and over | 700 |
| 25-29 | 694 |
| 22-24 | 550 |
| 18-19 | 505 |
| 20-21 | 408 |
| 30-34 | 378 |
| Under 18 | 0 |
Footnotes
*The racial-ethnic minorities count is calculated by taking the total number of students and subtracting white students, international students, and students whose race/ethnicity was unknown. This number is then divided by the total number of students at the school to obtain the racial-ethnic minorities percentage.
References
Department of Homeland Security Citizenship and Immigration Services
Image Credit: By Published by The Springfield News Company Tichnor Bros. Inc., Boston, Mass. under License
Find out how College Factual created their Diversity Rankings.