American Military University total enrollment is approximately 50,047 students. 2,522 are undergraduates and 662 are graduate students.
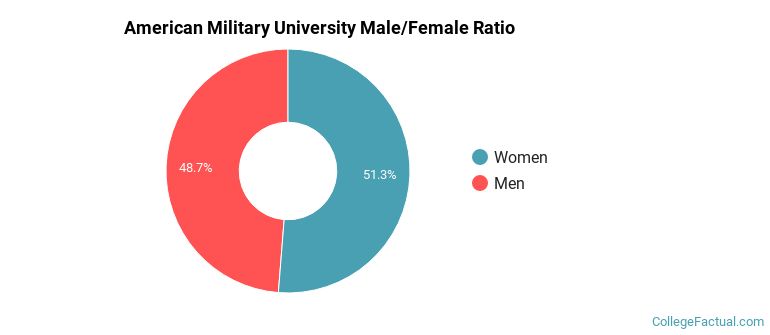
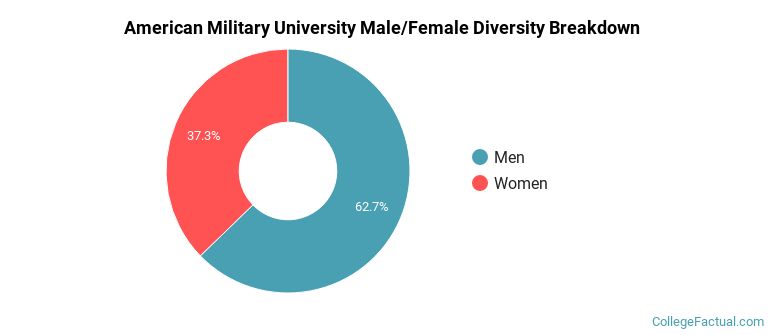
Male/Female Breakdown of Undergraduates
The full-time American Military University undergraduate population is made up of 47% women, and 53% men.
For the gender breakdown for all students, go here.
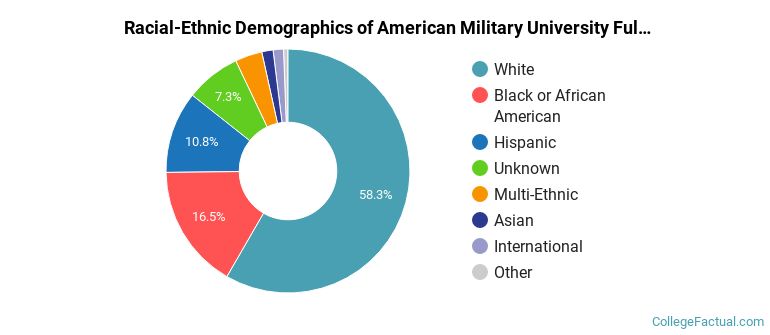
American Military University Racial/Ethnic Breakdown of Undergraduates
| Race/Ethnicity | Number |
|---|---|
| White | 1,387 |
| Black or African American | 396 |
| Hispanic | 317 |
| Unknown | 164 |
| Multi-Ethnic | 117 |
| Asian | 63 |
| International | 41 |
| Native Hawaiian or Pacific Islander | 17 |
See racial/ethnic breakdown for all students.
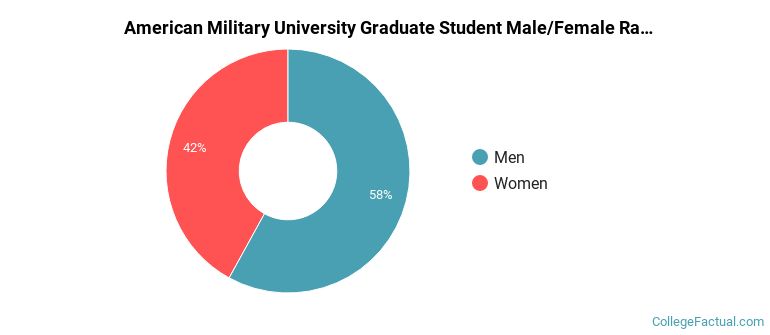
Male/Female Breakdown of Graduate Students
About 42% of full-time grad students are women, and 58% men.
For the gender breakdown for all students, go here.
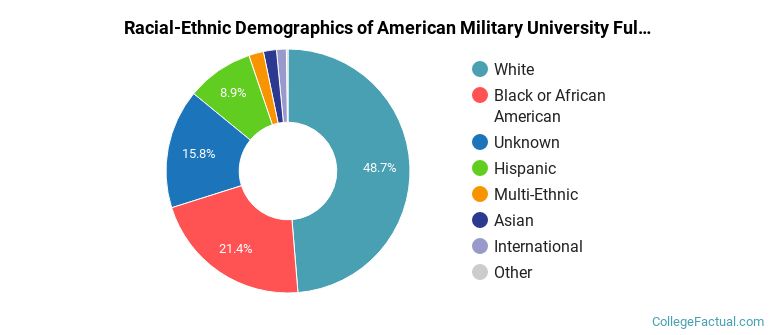
American Military University Racial-Ethnic Breakdown of Graduate Students
| Race/Ethnicity | Number |
|---|---|
| White | 323 |
| Black or African American | 135 |
| Hispanic | 87 |
| Unknown | 61 |
| Multi-Ethnic | 23 |
| Asian | 14 |
| International | 9 |
| Native Hawaiian or Pacific Islander | 5 |
See racial/ethnic breakdown for all students.

| Race/Ethnicity | Number |
|---|---|
| White | 26,083 |
| Black or African American | 7,730 |
| Hispanic | 7,597 |
| Unknown | 3,860 |
| Multi-Ethnic | 2,171 |
| Asian | 1,311 |
| International | 542 |
| Native Hawaiian or Pacific Islander | 463 |
There are approximately 18,332 female students and 31,715 male students at American Military University.
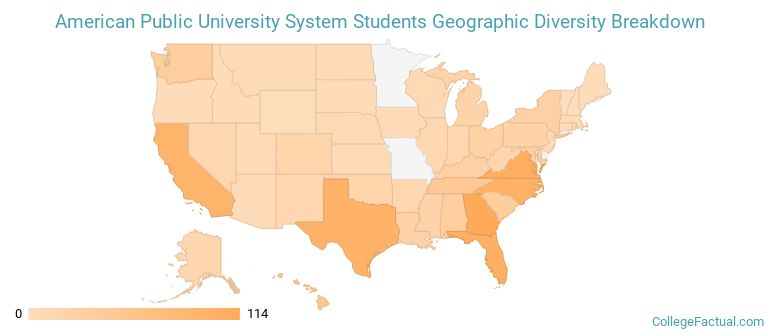
American Military University ranks 4 out of 2,183 when it comes to geographic diversity.
98.52% of American Military University students come from out of state, and 0.9% come from out of the country.
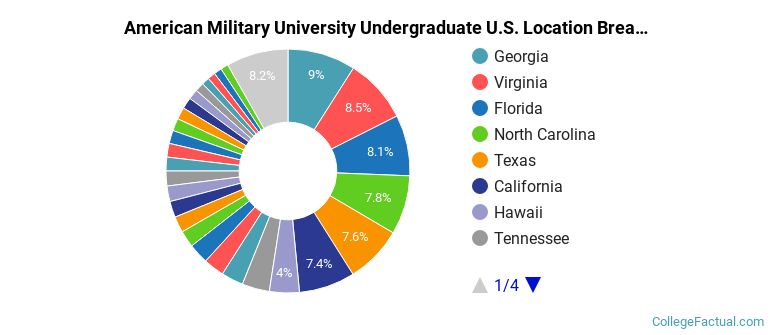
The undergraduate student body is split among 48 states (may include Washington D.C.). Click on the map for more detail.
| State | Amount |
|---|---|
| Georgia | 114 |
| Virginia | 108 |
| Florida | 102 |
| North Carolina | 99 |
| Texas | 96 |
Learn more about international students at American Military University.
A traditional college student is defined as being between the ages of 18-21. At American Military University, 3.91% of students fall into that category, compared to the national average of 60%.
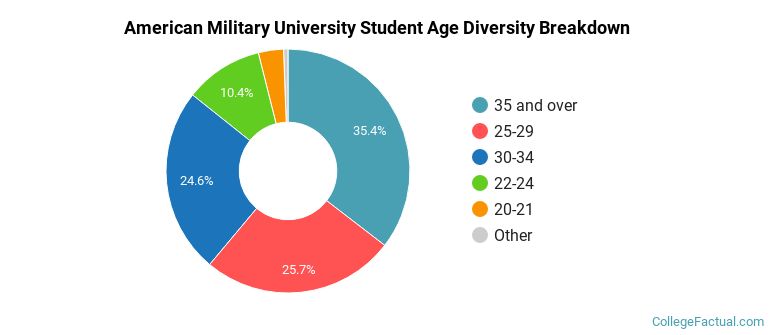
| Student Age Group | Amount |
|---|---|
| 35 and over | 16,396 |
| 25-29 | 11,877 |
| 30-34 | 11,389 |
| 22-24 | 4,799 |
| 20-21 | 1,544 |
| 18-19 | 271 |
| Under 18 | 0 |
Footnotes
*The racial-ethnic minorities count is calculated by taking the total number of students and subtracting white students, international students, and students whose race/ethnicity was unknown. This number is then divided by the total number of students at the school to obtain the racial-ethnic minorities percentage.
References
Department of Homeland Security Citizenship and Immigration Services
Find out how College Factual created their Diversity Rankings.