Anna Maria total enrollment is approximately 1,492 students. 960 are undergraduates and 99 are graduate students.
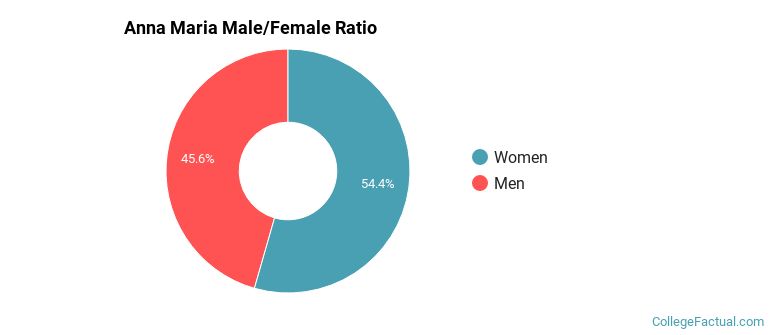
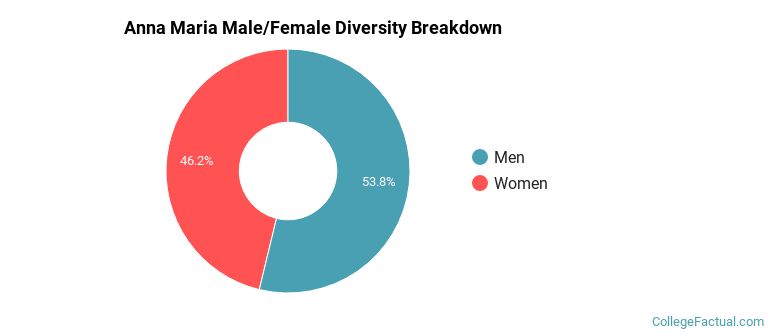
Male/Female Breakdown of Undergraduates
The full-time Anna Maria undergraduate population is made up of 50% women, and 50% men.
For the gender breakdown for all students, go here.
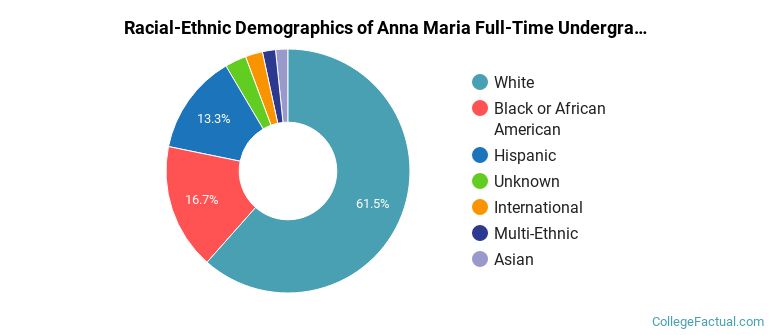
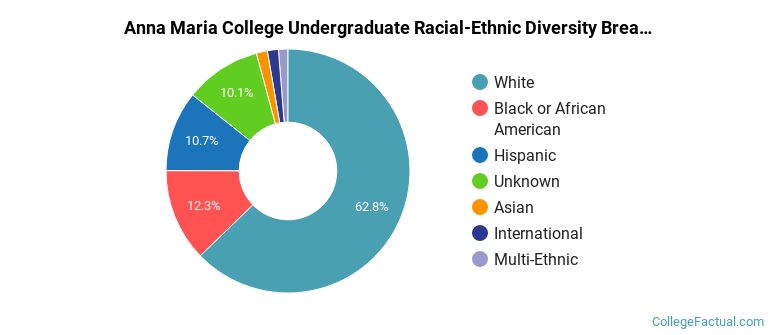
Anna Maria Racial/Ethnic Breakdown of Undergraduates
| Race/Ethnicity | Number |
|---|---|
| White | 534 |
| Black or African American | 154 |
| Hispanic | 95 |
| Unknown | 86 |
| Multi-Ethnic | 41 |
| International | 33 |
| Asian | 12 |
| Native Hawaiian or Pacific Islander | 1 |
See racial/ethnic breakdown for all students.
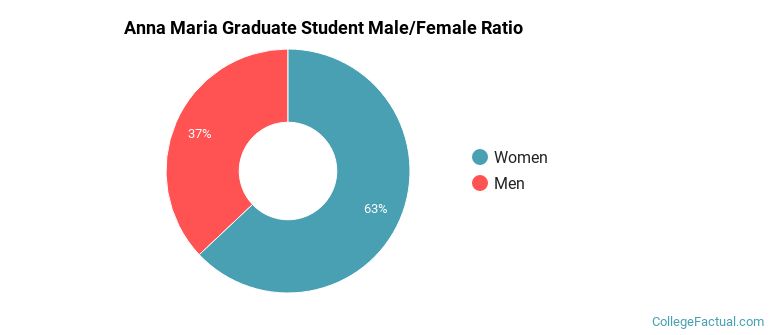
Male/Female Breakdown of Graduate Students
About 44% of full-time grad students are women, and 56% men.
For the gender breakdown for all students, go here.
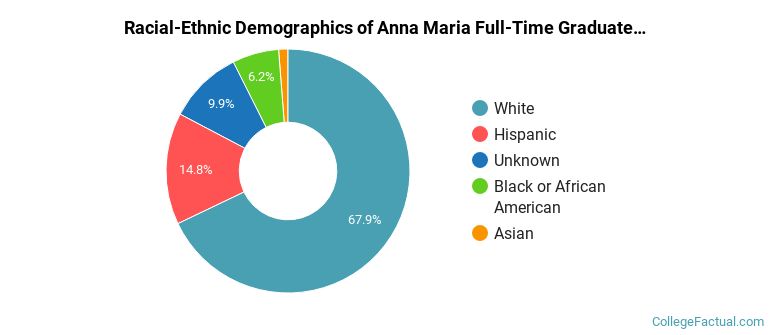
Anna Maria Racial-Ethnic Breakdown of Graduate Students
| Race/Ethnicity | Number |
|---|---|
| White | 73 |
| Unknown | 9 |
| Black or African American | 7 |
| Hispanic | 7 |
| Asian | 1 |
| International | 1 |
| Multi-Ethnic | 1 |
| Native Hawaiian or Pacific Islander | 0 |
See racial/ethnic breakdown for all students.
| Race/Ethnicity | Number |
|---|---|
| White | 883 |
| Unknown | 213 |
| Black or African American | 176 |
| Hispanic | 117 |
| Multi-Ethnic | 44 |
| International | 37 |
| Asian | 16 |
| Native Hawaiian or Pacific Islander | 1 |
There are approximately 625 female students and 867 male students at Anna Maria.
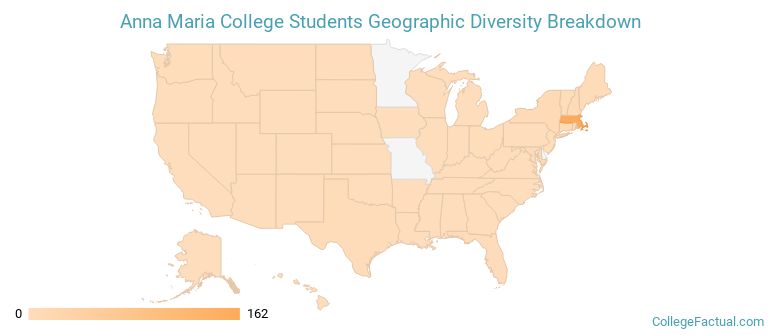
Anna Maria ranks 1,230 out of 2,183 when it comes to geographic diversity.
25.69% of Anna Maria students come from out of state, and 0% come from out of the country.
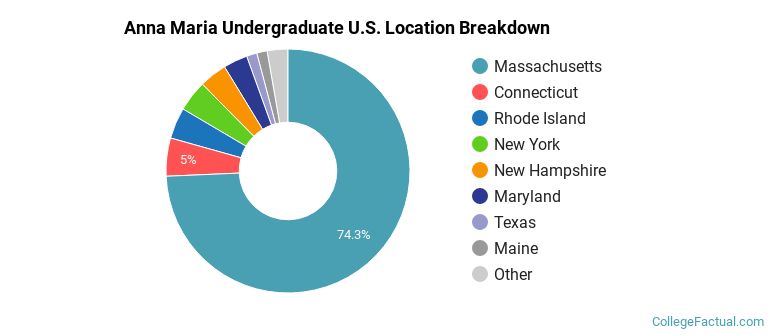
The undergraduate student body is split among 13 states (may include Washington D.C.). Click on the map for more detail.
| State | Amount |
|---|---|
| Massachusetts | 162 |
| Connecticut | 11 |
| New York | 9 |
| Rhode Island | 9 |
| New Hampshire | 8 |
Students from 4 countries are represented at this school, with the majority of the international students coming from Kenya, Albania, and France.
Learn more about international students at Anna Maria.
A traditional college student is defined as being between the ages of 18-21. At Anna Maria, 46.09% of students fall into that category, compared to the national average of 60%.
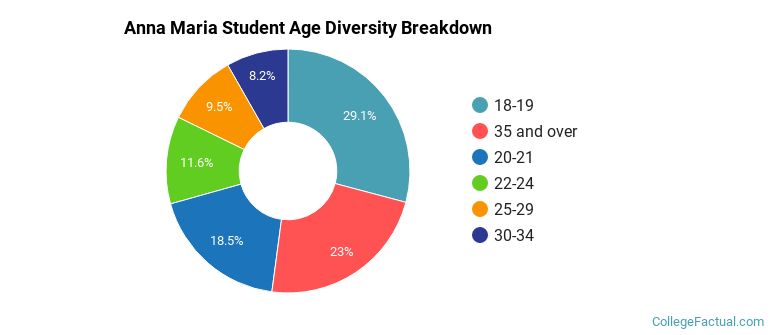
| Student Age Group | Amount |
|---|---|
| 18-19 | 407 |
| 35 and over | 321 |
| 20-21 | 259 |
| 22-24 | 162 |
| 25-29 | 133 |
| 30-34 | 115 |
| Under 18 | 0 |
Footnotes
*The racial-ethnic minorities count is calculated by taking the total number of students and subtracting white students, international students, and students whose race/ethnicity was unknown. This number is then divided by the total number of students at the school to obtain the racial-ethnic minorities percentage.
References
Department of Homeland Security Citizenship and Immigration Services
Image Credit: By John Phelan under License