In its yearly rankings, College Factual analyzes over 2,000 colleges and universities to determine which ones are the best in a variety of categories, such as overall value, quality, diversity, which schools are the best for each major, and much more.
Antelope Valley College was awarded 11 badges in the 2025 rankings. The highest ranked major at the school is liberal arts.
Explore the best ranked schools for the programs you are most interested in.
Antelope Valley College is ranked #1,713 out of 2,152 schools in the nation for overall quality on College Factual's 2025 Best Colleges list. This is an improvement over the previous year, when Antelope Valley College held the #1,927 spot on the Best Overall Colleges list.
Antelope Valley College is also ranked #147 out of 161 schools in California.
As long as you meet basic requirements, you should not have any trouble getting into Antelope Valley College since the school has an open admissions policy. Still, be sure to submit any requested materials and that your application is completed in full.
The student to faculty ratio is often used as a measure to gauge how much access students will have to their professors - the lower the number, the better. At Antelope Valley College, this rate is 22 to 1, which is high when compared to the national average of 15 to 1.
When estimating how much access students will have to their teachers, some people like to look at what percentage of faculty members are full time. This is because part-time teachers may not have as much time to spend on campus as their full-time counterparts.
The full-time faculty percentage at Antelope Valley College is 25%. This is lower than the national average of 47%.
During the 2017-2018 academic year, there were 12,057 undergraduates at Antelope Valley College with 3,782 being full-time and 8,275 being part-time.
The net price is calculated by adding tuition, room, board and other costs and subtracting financial aid.Note that the net price is typically less than the published for a school. For more information on the sticker price of Antelope Valley College, see our tuition and fees and room and board pages.
While almost two-thirds of students nationwide take out loans to pay for college, the percentage may be quite different for the school you plan on attending. At Antelope Valley College, approximately 1% of students took out student loans averaging $7,334 a year. That adds up to $29,336 over four years for those students.
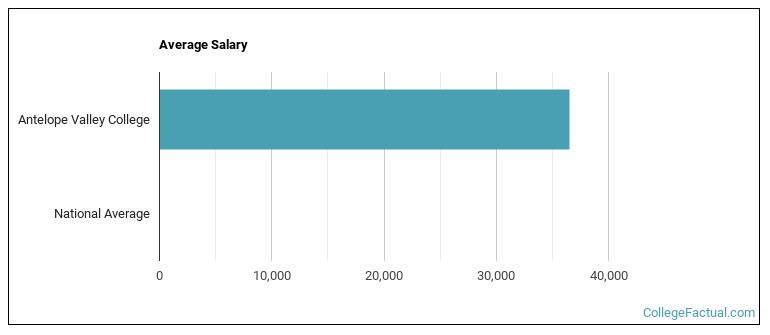
See which majors at Antelope Valley College make the most money.
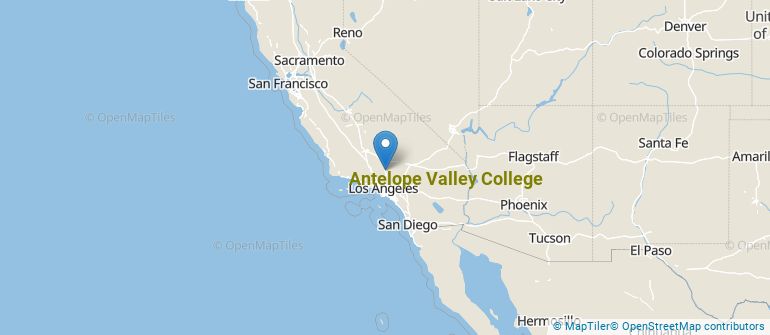
Get more details about the location of Antelope Valley College.
Contact details for Antelope Valley College are given below.
| Contact Details | |
|---|---|
| Address: | 3041 West Ave K, Lancaster, CA 93536-5426 |
| Phone: | 661-722-6300 |
| Website: | www.avc.edu/ |
| Most Popular Majors | Bachelor’s Degrees | Average Salary of Graduates |
|---|---|---|
| Liberal Arts General Studies | 857 | NA |
| Vehicle Maintenance & Repair | 610 | NA |
| General Social Sciences | 355 | NA |
| Biological & Physical Science | 181 | NA |
| Criminal Justice & Corrections | 177 | NA |
| Human Development & Family Studies | 155 | NA |
| Business Administration & Management | 150 | NA |
| General Psychology | 97 | NA |
| American Sign Language | 82 | NA |
| Nursing | 71 | NA |
Online courses area a great option for busy, working students as well as for those who have scheduling conflicts and want to study on their own time. As time goes by, expect to see more and more online learning options become available.
In 2022-2023, 5,538 students took at least one online class at Antelope Valley College. This is a decrease from the 6,490 students who took online classes the previous year.
| Year | Took at Least One Online Class | Took All Classes Online |
|---|---|---|
| 2022-2023 | 5,538 | 2,375 |
| 2021-2022 | 6,490 | 3,440 |
| 2020-2021 | 2,837 | 595 |
| 2018-2019 | 2,663 | 688 |
Learn more about online learning at Antelope Valley College.
Footnotes
*The racial-ethnic minorities count is calculated by taking the total number of students and subtracting white students, international students, and students whose race/ethnicity was unknown. This number is then divided by the total number of students at the school to obtain the racial-ethnic minorities percentage.
References
More about our data sources and methodologies.