Appalachian State total enrollment is approximately 20,023 students. 16,905 are undergraduates and 867 are graduate students.
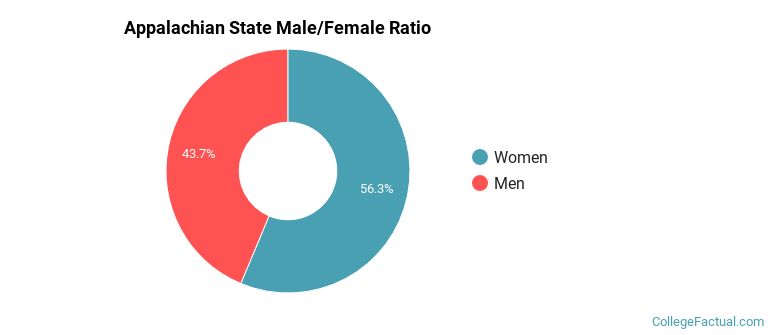
Male/Female Breakdown of Undergraduates
The full-time Appalachian State undergraduate population is made up of 57% women, and 43% men.
For the gender breakdown for all students, go here.
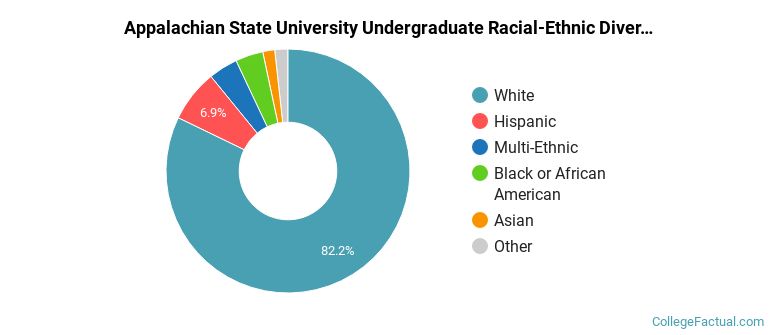
Appalachian State Racial/Ethnic Breakdown of Undergraduates

| Race/Ethnicity | Number |
|---|---|
| White | 13,728 |
| Hispanic | 1,356 |
| Multi-Ethnic | 738 |
| Black or African American | 590 |
| Asian | 273 |
| Unknown | 129 |
| International | 68 |
| Native Hawaiian or Pacific Islander | 1 |
See racial/ethnic breakdown for all students.
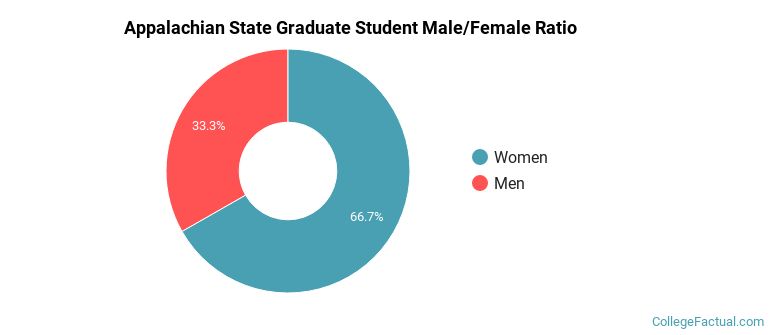
Male/Female Breakdown of Graduate Students
About 65% of full-time grad students are women, and 35% men.
For the gender breakdown for all students, go here.
Appalachian State Racial-Ethnic Breakdown of Graduate Students

| Race/Ethnicity | Number |
|---|---|
| White | 735 |
| Hispanic | 50 |
| Black or African American | 35 |
| International | 20 |
| Multi-Ethnic | 10 |
| Asian | 7 |
| Unknown | 7 |
| Native Hawaiian or Pacific Islander | 0 |
See racial/ethnic breakdown for all students.
| Race/Ethnicity | Number |
|---|---|
| White | 16,331 |
| Hispanic | 1,509 |
| Multi-Ethnic | 809 |
| Black or African American | 782 |
| Asian | 306 |
| Unknown | 156 |
| International | 92 |
| Native Hawaiian or Pacific Islander | 1 |

There are approximately 11,731 female students and 8,292 male students at Appalachian State.
Appalachian State ranks 1,122 out of 2,183 when it comes to geographic diversity.
9.7% of Appalachian State students come from out of state, and 0.26% come from out of the country.

The undergraduate student body is split among 29 states (may include Washington D.C.). Click on the map for more detail.

| State | Amount |
|---|---|
| North Carolina | 2,811 |
| South Carolina | 52 |
| Georgia | 50 |
| Florida | 46 |
| Virginia | 44 |
Students from 48 countries are represented at this school, with the majority of the international students coming from China, Australia, and Venezuela.
Learn more about international students at Appalachian State.
A traditional college student is defined as being between the ages of 18-21. At Appalachian State, 69.25% of students fall into that category, compared to the national average of 60%.

| Student Age Group | Amount |
|---|---|
| 20-21 | 6,613 |
| 18-19 | 6,414 |
| 22-24 | 3,177 |
| 25-29 | 1,082 |
| 35 and over | 771 |
| 30-34 | 388 |
| Under 18 | 0 |
Footnotes
*The racial-ethnic minorities count is calculated by taking the total number of students and subtracting white students, international students, and students whose race/ethnicity was unknown. This number is then divided by the total number of students at the school to obtain the racial-ethnic minorities percentage.
References
Department of Homeland Security Citizenship and Immigration Services
Image Credit: By Clayhefner under License
Read College Factual's Diversity Ranking Methodology.