Here is an overview of this program at ASU Tempe. You can study it at the Bachelor’s, Certificate levels, with graduate study also available. It ranks as high as #2 out of 4 schools (Bachelor’s level) by College Factual. Jump to any of the following sections:
College Factual rates ASU Tempe as a strong choice for ethnic studies, ranked #48 out of 124 schools nationally.Ranking Rank Best Ethnic Studies Schools 48 of 124 Best Ethnic Studies Schools in Arizona 2 of 4 Best Ethnic Studies Schools in the Southwest Region 2 of 8
The following degree levels are granted in ethnic studies at ASU Tempe, along with how many graduates complete each level annually.Degree Level Annual Graduates Bachelor’s 35 Certificate 37 Master’s 9 Doctoral 3 Graduate Certificate 10
For the most recent IPEDS reporting year, Arizona State University Campus Immersion conferred 35 bachelor’s degrees in ethnic studies.
ASU Tempe is among the very best schools in the country for ethnic studies at the bachelor’s level. Its best result was #2 out of 4 schools by College Factual.
Ethnic Studies graduates with a bachelor’s degree from ASU Tempe go on to jobs where they make a median salary of $41,617 a year. This is lower than $72,410, the median for all majors at ASU Tempe.
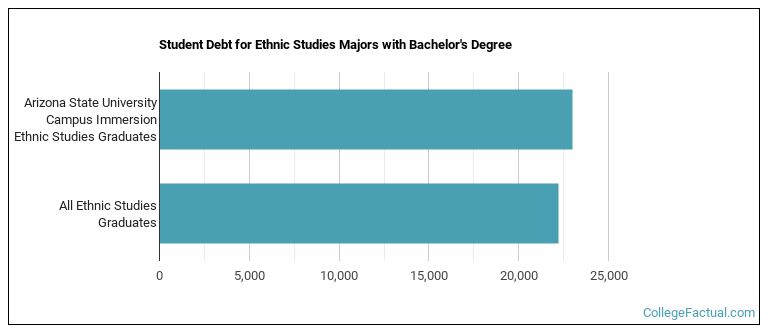
Earning a bachelor’s degree at ASU Tempe, ethnic studies graduates take on a median debt of $23,000 in student loans. This is above $22,239, the typical median for all majors at ASU Tempe.
Information about average full-time undergraduate tuition and fees is shown in the table below.In State Out of State Tuition $10,710 $32,394 Fees $745 $745
Learn more about ASU Tempe tuition and fees.
Among recent graduates, 26% of ethnic studies bachelor’s degrees went to men and 74% went to women.
 The largest share of ethnic studies bachelor’s degree graduates at ASU Tempe were Hispanic or Latino. About 40% of graduates fell into this category.
The following table and chart show the ethnic background for students who recently graduated from Arizona State University Campus Immersion with a bachelor’s in ethnic studies.

| Ethnic Background | Number of Students |
|---|---|
| Asian | 1 |
| Black or African American | 3 |
| Hispanic or Latino | 14 |
| White | 2 |
| Non-Resident Aliens | 0 |
| Other Races | 15 |
ASU Tempe awarded 12 bachelor’s completions in american indian/native american studies in the latest year of data — 67% to women and 33% to men. The most common background among these graduates was Hispanic or Latino (8%).
ASU Tempe conferred 11 bachelor’s completions in hispanic-american, puerto rican, and mexican-american/chicano studies in the latest year of data — 73% to women and 27% to men. The largest share of these graduates were Hispanic or Latino (64%).
ASU Tempe awarded 9 bachelor’s degrees in women’s studies recently — 89% to women and 11% to men. The most common background among these graduates was Hispanic or Latino (56%).
ASU Tempe awarded 2 bachelor’s completions in african-american/black studies in the most recent reporting year — 50% to women and 50% to men. The most common background among these graduates was Black or African American (100%).
ASU Tempe granted 1 bachelor’s degree in disability studies in the latest year of data — 100% to women and 0% to men. The largest share of these graduates were Hispanic or Latino (100%).
For the most recent IPEDS reporting year, Arizona State University Campus Immersion handed out 37 certificate degrees in ethnic studies.
ASU Tempe is not yet ranked for ethnic studies at the certificate level.
For the most recent academic year available, 24% of ethnic studies certificate degrees went to men and 76% went to women.
 The largest share of ethnic studies certificate degree graduates at ASU Tempe were Hispanic or Latino. About 35% of graduates fell into this category.
The following table and chart show the ethnic background for students who recently graduated from Arizona State University Campus Immersion with a certificate in ethnic studies.

| Ethnic Background | Number of Students |
|---|---|
| Asian | 1 |
| Black or African American | 2 |
| Hispanic or Latino | 13 |
| White | 11 |
| Non-Resident Aliens | 0 |
| Other Races | 10 |
ASU Tempe awarded 12 certificate degrees in disability studies recently — 92% to women and 8% to men. The largest share of these graduates were White (67%).
ASU Tempe conferred 7 certificate completions in hispanic-american, puerto rican, and mexican-american/chicano studies in the most recent reporting year — 71% to women and 29% to men. Most of these graduates identified as Hispanic or Latino (100%).
ASU Tempe granted 7 certificate completions in american indian/native american studies in the most recent reporting year — 57% to women and 43% to men. Most of these graduates identified as Hispanic or Latino (14%).
ASU Tempe awarded 5 certificate degrees in gay/lesbian studies recently — 80% to women and 20% to men. Most of these graduates identified as Hispanic or Latino (60%).
ASU Tempe awarded 4 certificate completions in women’s studies recently — 100% to women and 0% to men. Most of these graduates identified as Hispanic or Latino (25%).
ASU Tempe conferred 2 certificate degrees in african-american/black studies in the most recent reporting year — 0% to women and 100% to men. Most of these graduates identified as Black or African American (50%).
Graduate study is also available at ASU Tempe. Here are the graduate award levels offered.Graduate Level Annual Graduates Master’s Degrees in Ethnic Studies 9 Doctoral Degrees in Ethnic Studies 3 Graduate Certificate Degrees in Ethnic Studies 10
