Explore the best ranked schools for the programs you are most interested in.
According to College Factual's 2025 analysis, ASUN is ranked #1,967 out of 2,152 schools in the nation that were analyzed for overall quality.
ASUN also holds the #29 spot on the Best Colleges in Arkansas ranking.
See all of the rankings for Arkansas State University - Newport.
Returning adults and other non-traditional students may appreciate the fact that Arkansas State University - Newport has an open admissions policy. This means that you'll only have to submit basic materials, which may include proof that you completed high school or an equivalent program.
At ASUN, the student to faculty ratio is an excellent 11 to 1. That's much better than the national average of 15 to 1. This indicates that many classes will probably be small, and students will have ample opportunites to work closely with their professors and classmates.
When estimating how much access students will have to their teachers, some people like to look at what percentage of faculty members are full time. This is because part-time teachers may not have as much time to spend on campus as their full-time counterparts.
The full-time faculty percentage at Arkansas State University - Newport is 51%. This is higher than the national average of 47%.
The freshmen retention rate is a sign of how many full-time students like a college or university well enough to come back for their sophomore year. At Arkansas State University - Newport this rate is 55%, which is a bit lower than the national average of 68%.
During the 2017-2018 academic year, there were 1,941 undergraduates at ASUN with 767 being full-time and 1,174 being part-time.
| $0-30 K | $30K-48K | $48-75 | $75-110K | $110K + |
|---|---|---|---|---|
| $8,595 | $9,395 | $10,727 | $12,540 | $14,338 |
The net price is calculated by adding tuition, room, board and other costs and subtracting financial aid.Note that the net price is typically less than the published for a school. For more information on the sticker price of ASUN, see our tuition and fees and room and board pages.
While almost two-thirds of students nationwide take out loans to pay for college, the percentage may be quite different for the school you plan on attending. At ASUN, approximately 13% of students took out student loans averaging $5,190 a year. That adds up to $20,760 over four years for those students.
Get more details about paying for Arkansas State University - Newport.
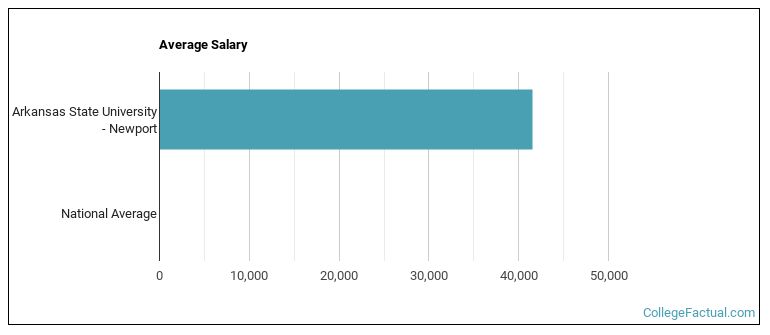
See which majors at Arkansas State University - Newport make the most money.
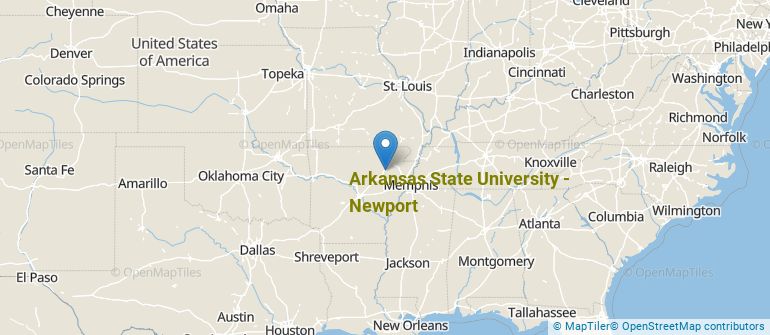
Get more details about the location of Arkansas State University - Newport.
Contact details for ASUN are given below.
| Contact Details | |
|---|---|
| Address: | 7648 Victory Blvd, Newport, AR 72112 |
| Phone: | 870-512-7800 |
| Website: | https://www.asun.edu/ |
| Most Popular Majors | Bachelor’s Degrees | Average Salary of Graduates |
|---|---|---|
| Practical Nursing & Nursing Assistants | 307 | NA |
| Ground Transportation | 212 | NA |
| Liberal Arts General Studies | 153 | NA |
| Other Multi/Interdisciplinary Studies | 92 | NA |
| Vehicle Maintenance & Repair | 79 | NA |
| Nursing | 63 | NA |
| Teacher Education Grade Specific | 51 | NA |
| Clinical/Medical Laboratory Science | 44 | NA |
| Cosmetology | 36 | NA |
| Allied Health Professions | 33 | NA |
Online courses area a great option for busy, working students as well as for those who have scheduling conflicts and want to study on their own time. As time goes by, expect to see more and more online learning options become available.
In 2022-2023, 772 students took at least one online class at Arkansas State University - Newport. This is a decrease from the 979 students who took online classes the previous year.
| Year | Took at Least One Online Class | Took All Classes Online |
|---|---|---|
| 2022-2023 | 772 | 466 |
| 2021-2022 | 979 | 583 |
| 2020-2021 | 1,201 | 745 |
| 2018-2019 | 1,169 | 318 |
Learn more about online learning at Arkansas State University - Newport.
Footnotes
*The racial-ethnic minorities count is calculated by taking the total number of students and subtracting white students, international students, and students whose race/ethnicity was unknown. This number is then divided by the total number of students at the school to obtain the racial-ethnic minorities percentage.
References
More about our data sources and methodologies.