Make an informed decision about your education by understanding how UAGC's retention and graduation rates impact you. First year retention rates let you know how many students come back for their sophomore year. Graduation rates tell you how long it takes to complete a degree at UAGC . Remember, every extra semester it takes to graduate will increase the cost of your degree.

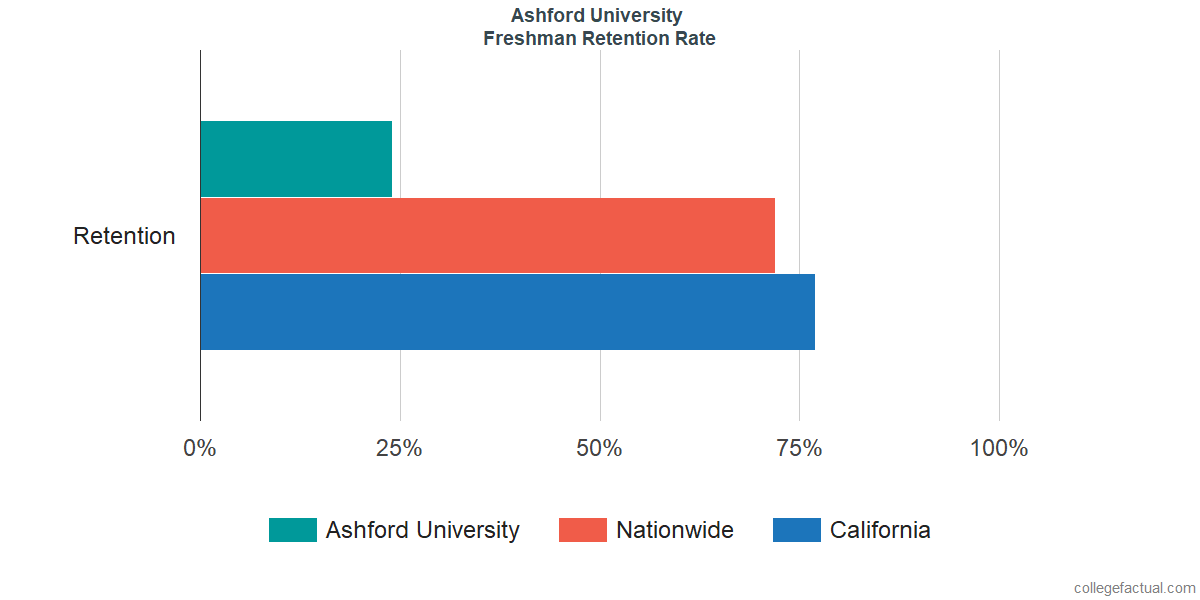
You have to make it past freshman year in order to graduate. With only 23.0% of students staying on to become sophomores, The University of Arizona Global Campus has among the worst freshman retention rates in the country.
Nationwide, the average first year to second year retention rate is 69.0% . When looking at just colleges and universities in California , the average is 74.0% .
At UAGC , there were 64,651 bachelors degree candidates in the class of 2016 . By 2018 , six years after beginning their degree, 18.8% of these students had graduated. After an additional two years, 19.8% of this class eventually completed their degree.
We consider the "on-time" graduation rate for a bachelor's degree to be four years, but colleges typically report their graduation rates after six or even eight years.
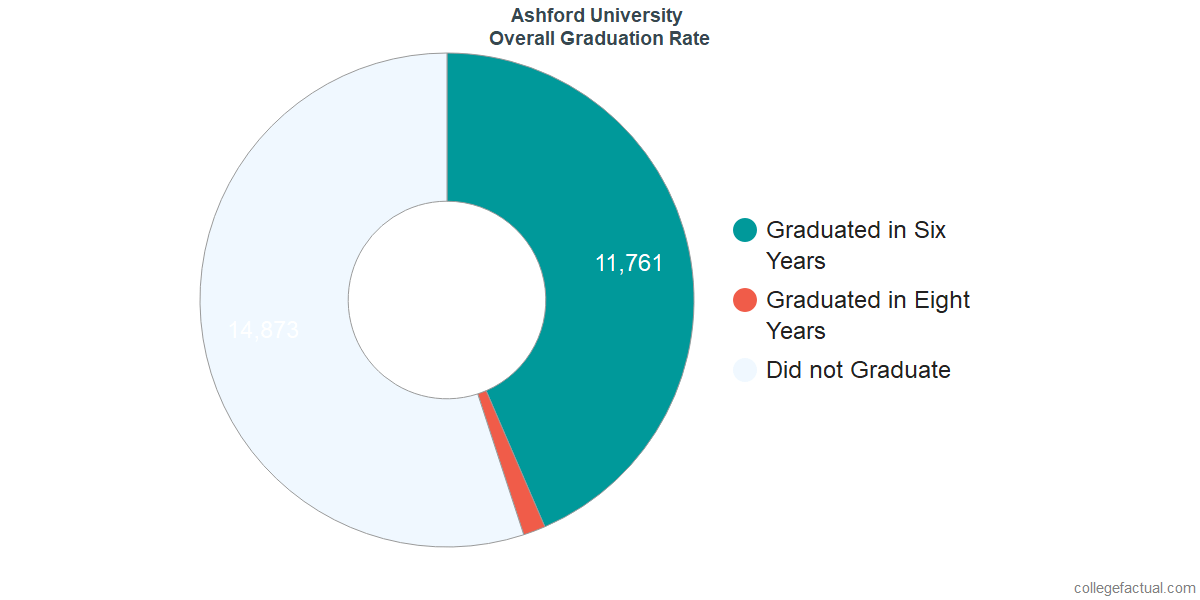
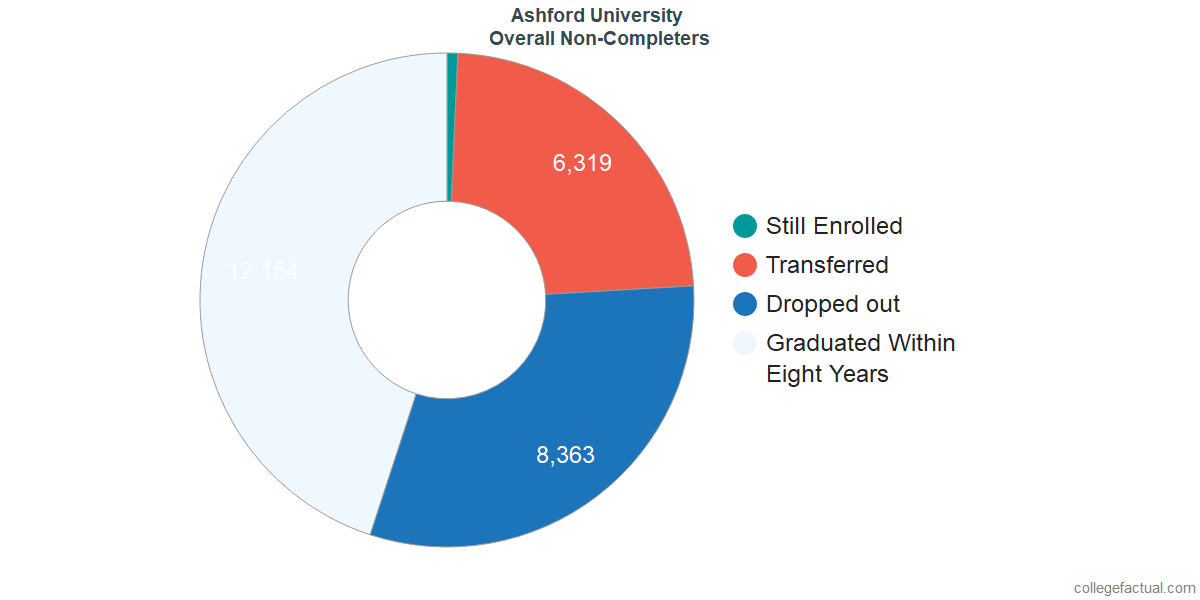
This implies that 80.2% did not graduate within eight years. Of these 51,868 students, 371 were still working towards their degree, 20,333 had transferred to a different institution, and UAGC lost contact with the remaining 31,163 whom we assume dropped out.
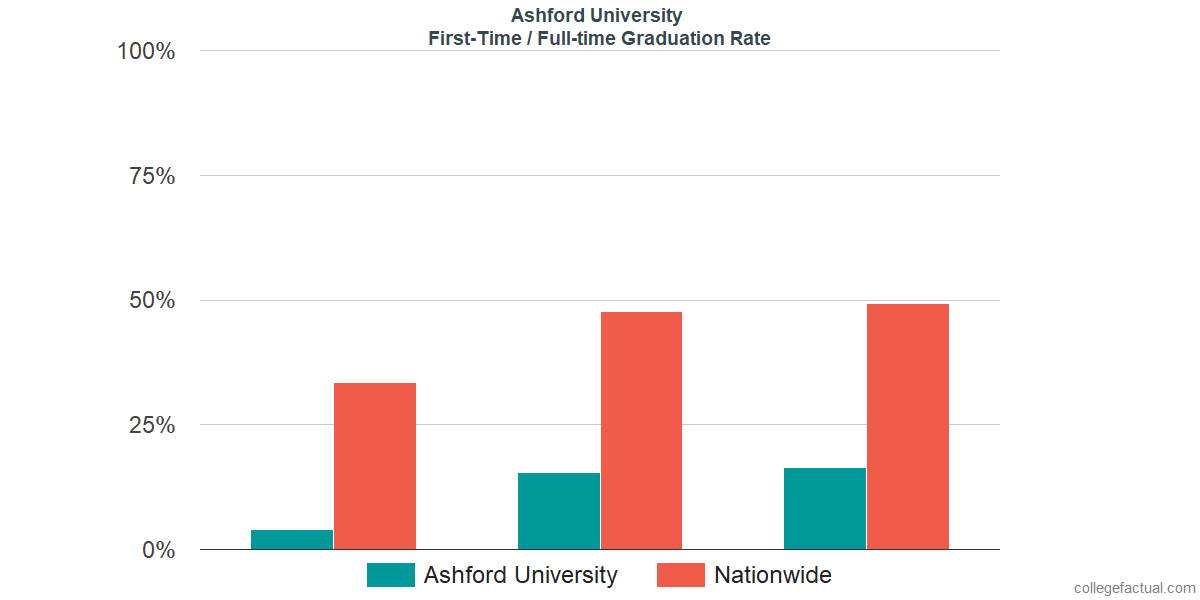
First-time, full-time students under the age of 25 are much more likely to graduate in four years (on-time). Some schools cater mostly to traditional students while others cater to “non-traditional” students who may be attending part time and thus are likely to take longer to graduate.
Comparing the graduation rates of specific cohorts shown below will be more revealing than the overall statistics shared above.
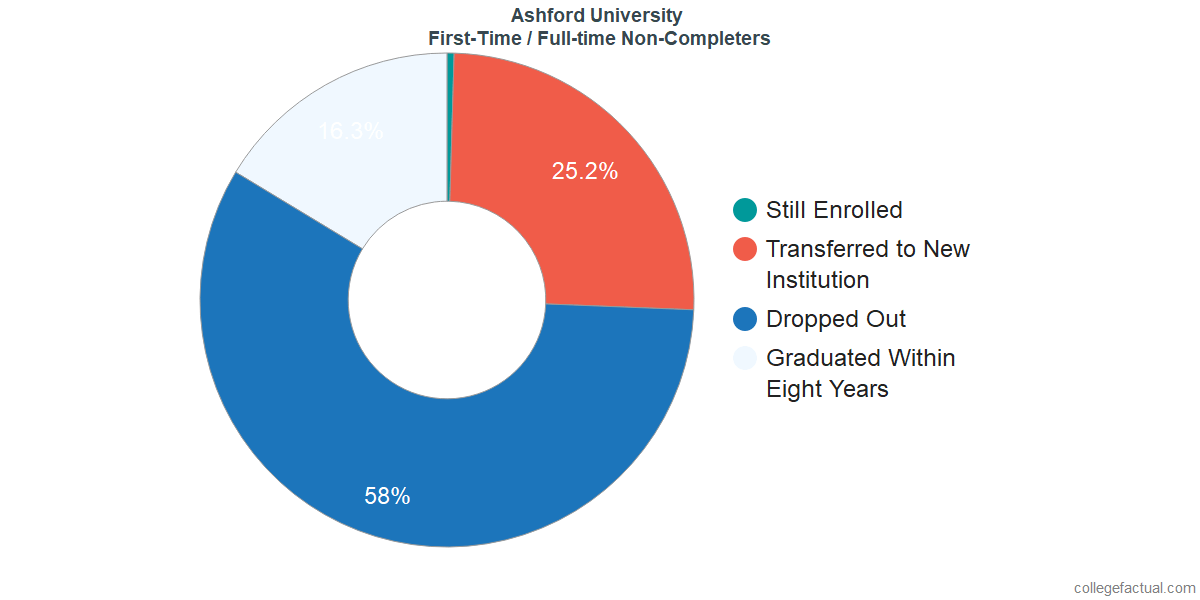
With a four year graduation rate of 1.0% , first-time students in the UAGC class of 2016 who attended classes full-time were among the least likely in the nation to graduate on time. After six years, the graduation rate was 8.2% and by 2020 ,8.5% of this class had completed their degree.
Nationwide, the average graduation rate for first-time undergraduates attending classes full-time is: 35.8% after four years, 46.4% after six years, and 47.8% after eight years.
Of these 10,014 students, 16 were still working towards their degree, 2,173 had transferred to a different institution, and UAGC lost contact with the remaining 7,825 whom we assume dropped out.
None of the students in UAGC's class of 2016 were classified as as a "first-time" student attending classes "part-time".
Nationwide, the average graduation rate for first-time undergraduates attending classes part-time is: 21.6% after six years and 23.7% after eight years.
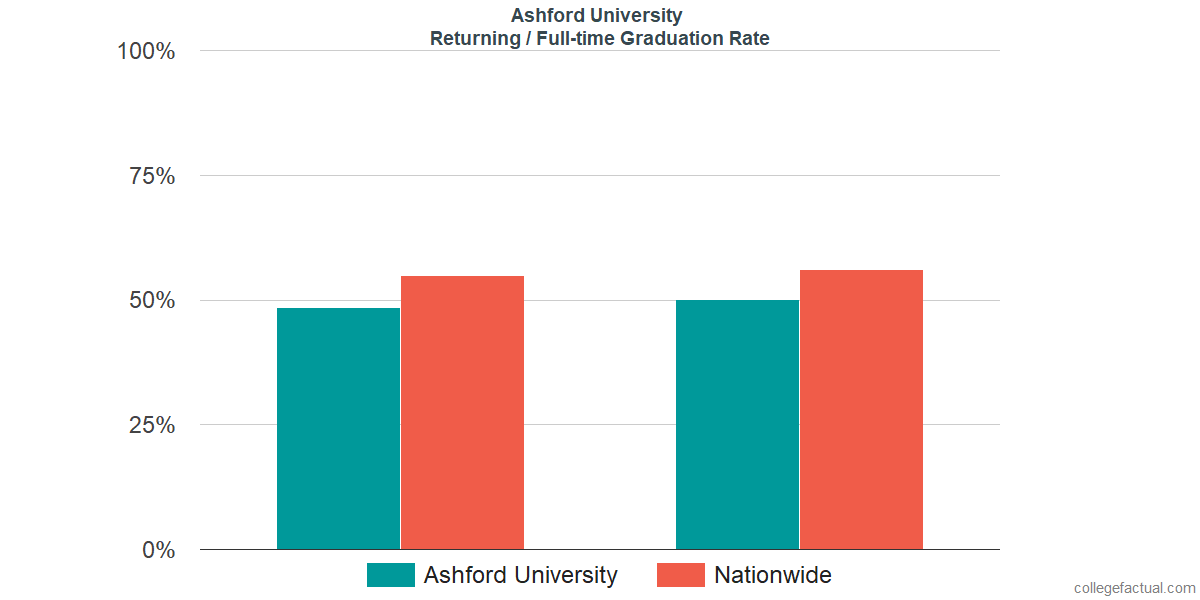
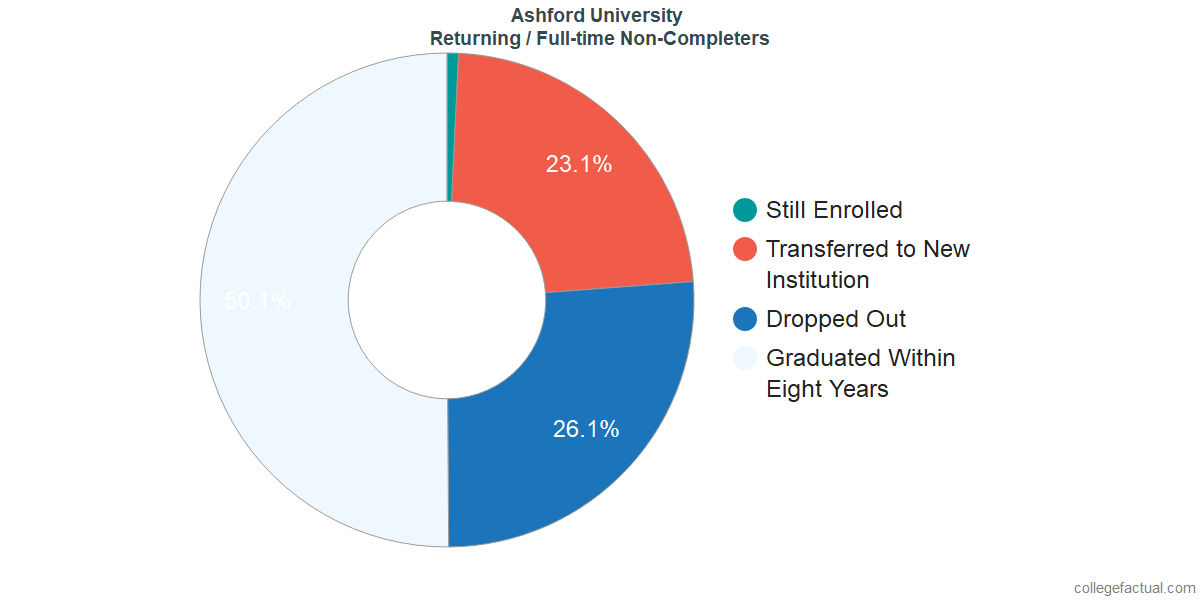
With a six year graduation rate of 21.0% , returning students in the UAGC class of 2016 who attended classes full-time were among the least likely in the nation to graduate in a reasonable time. After eight years, the graduation rate was 22.1% .
Nationwide, the average graduation rate for returning undergraduates attending classes full-time is: 53.8% after six years and 55.1% after eight years.
Of these 41,851 students, 355 were still working towards their degree, 18,159 had transferred to a different institution, and UAGC lost contact with the remaining 23,337 whom we assume dropped out.
None of the students in UAGC's class of 2016 were classified as as a "returning" student attending classes "part-time".
Nationwide, the average graduation rate for returning undergraduates attending classes part-time is: 36.0% after six years and 37.8% after eight years.