Ashland total enrollment is approximately 4,447 students. 2,310 are undergraduates and 763 are graduate students.
Male/Female Breakdown of Undergraduates
The full-time Ashland undergraduate population is made up of 62% women, and 38% men.
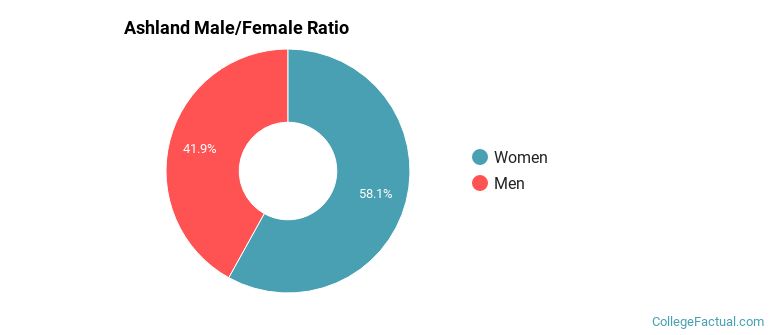
For the gender breakdown for all students, go here.
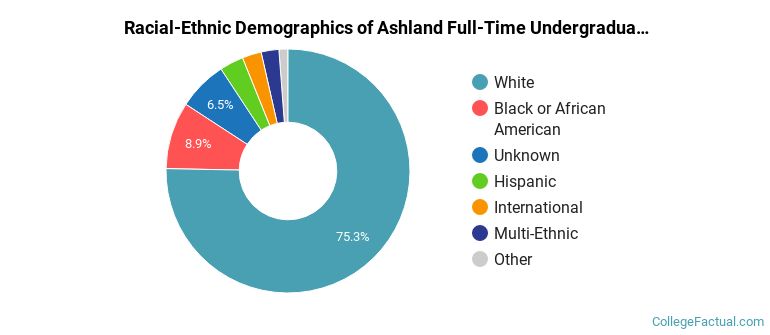
Ashland Racial/Ethnic Breakdown of Undergraduates
| Race/Ethnicity | Number |
|---|---|
| White | 1,771 |
| Unknown | 162 |
| Black or African American | 138 |
| Hispanic | 92 |
| Multi-Ethnic | 59 |
| International | 51 |
| Asian | 25 |
| Native Hawaiian or Pacific Islander | 4 |
See racial/ethnic breakdown for all students.
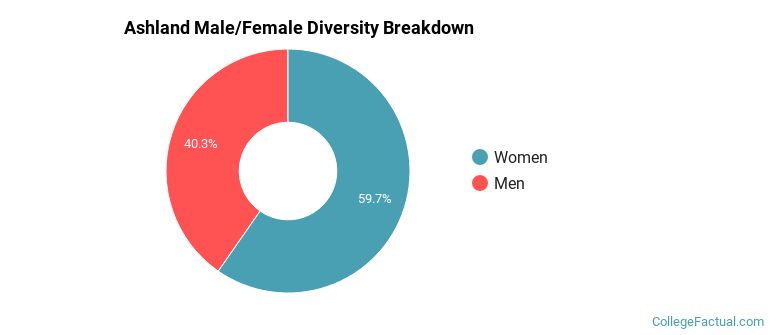
Male/Female Breakdown of Graduate Students
About 58% of full-time grad students are women, and 42% men.

For the gender breakdown for all students, go here.
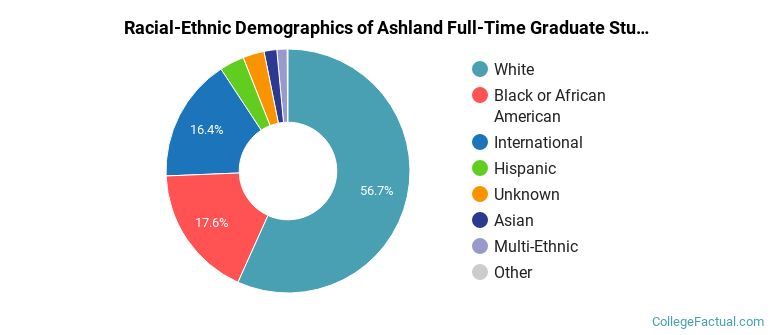
Ashland Racial-Ethnic Breakdown of Graduate Students
| Race/Ethnicity | Number |
|---|---|
| White | 478 |
| Black or African American | 137 |
| International | 87 |
| Hispanic | 17 |
| Unknown | 16 |
| Multi-Ethnic | 13 |
| Asian | 11 |
| Native Hawaiian or Pacific Islander | 0 |
See racial/ethnic breakdown for all students.

| Race/Ethnicity | Number |
|---|---|
| White | 3,369 |
| Black or African American | 375 |
| Unknown | 218 |
| Hispanic | 164 |
| International | 156 |
| Multi-Ethnic | 94 |
| Asian | 52 |
| Native Hawaiian or Pacific Islander | 5 |
There are approximately 2,759 female students and 1,688 male students at Ashland.
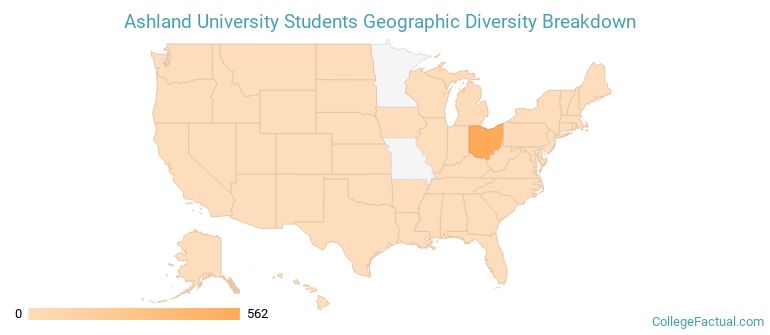
Ashland ranks 1,416 out of 2,183 when it comes to geographic diversity.
7.06% of Ashland students come from out of state, and 0% come from out of the country.
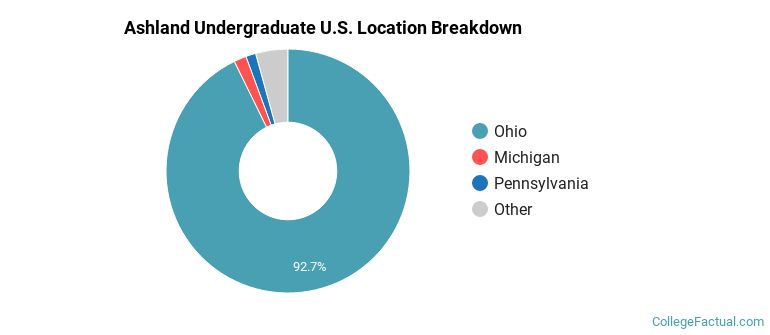
The undergraduate student body is split among 19 states (may include Washington D.C.). Click on the map for more detail.
| State | Amount |
|---|---|
| Ohio | 562 |
| Michigan | 10 |
| Pennsylvania | 8 |
| New York | 3 |
| California | 2 |
Students from 36 countries are represented at this school, with the majority of the international students coming from China, Nepal, and Saudi Arabia.
Learn more about international students at Ashland.
A traditional college student is defined as being between the ages of 18-21. At Ashland, 33.13% of students fall into that category, compared to the national average of 60%.
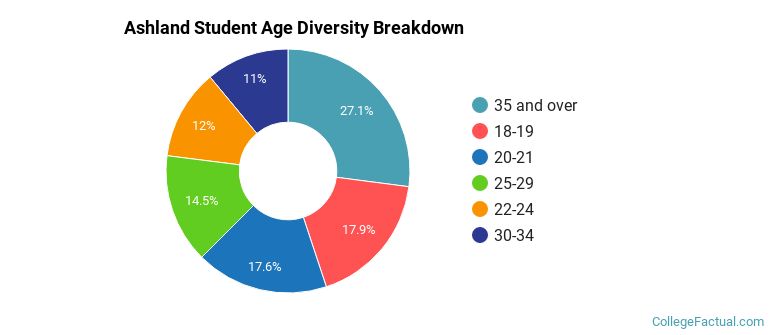
| Student Age Group | Amount |
|---|---|
| 35 and over | 1,637 |
| 18-19 | 1,080 |
| 20-21 | 1,064 |
| 25-29 | 878 |
| 22-24 | 724 |
| 30-34 | 667 |
| Under 18 | 0 |
Footnotes
*The racial-ethnic minorities count is calculated by taking the total number of students and subtracting white students, international students, and students whose race/ethnicity was unknown. This number is then divided by the total number of students at the school to obtain the racial-ethnic minorities percentage.
References