Athens State University total enrollment is approximately 2,867 students. 1,202 are undergraduates and 44 are graduate students.
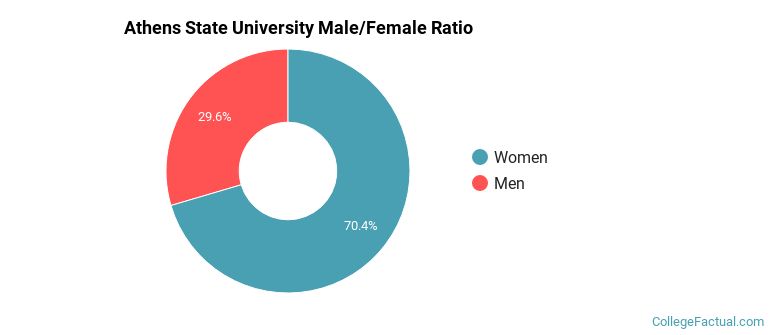
Male/Female Breakdown of Undergraduates
The full-time Athens State University undergraduate population is made up of 71% women, and 29% men.
For the gender breakdown for all students, go here.
Athens State University Racial/Ethnic Breakdown of Undergraduates
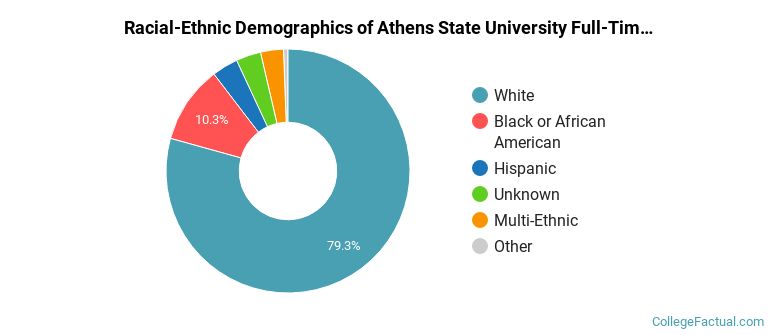
| Race/Ethnicity | Number |
|---|---|
| White | 949 |
| Black or African American | 128 |
| Hispanic | 43 |
| Unknown | 31 |
| Multi-Ethnic | 25 |
| Asian | 7 |
| International | 2 |
| Native Hawaiian or Pacific Islander | 1 |
See racial/ethnic breakdown for all students.
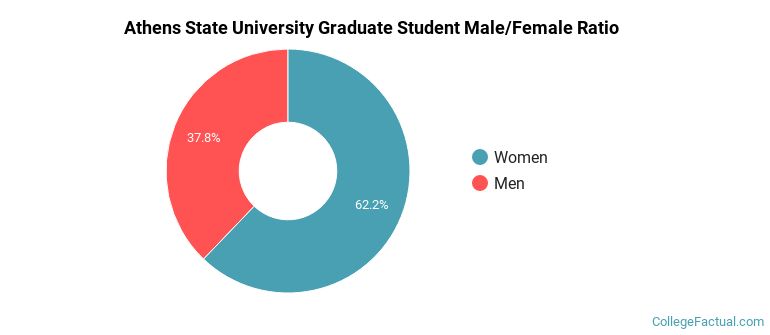
Male/Female Breakdown of Graduate Students
About 57% of full-time grad students are women, and 43% men.
For the gender breakdown for all students, go here.
Athens State University Racial-Ethnic Breakdown of Graduate Students
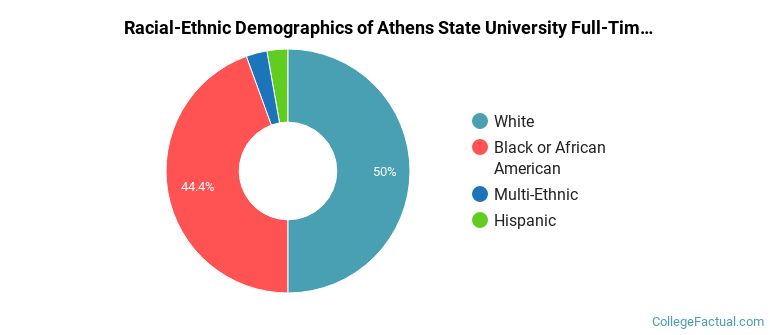
| Race/Ethnicity | Number |
|---|---|
| White | 26 |
| Black or African American | 12 |
| Hispanic | 3 |
| Multi-Ethnic | 3 |
| Asian | 0 |
| Native Hawaiian or Pacific Islander | 0 |
| International | 0 |
| Unknown | 0 |
See racial/ethnic breakdown for all students.
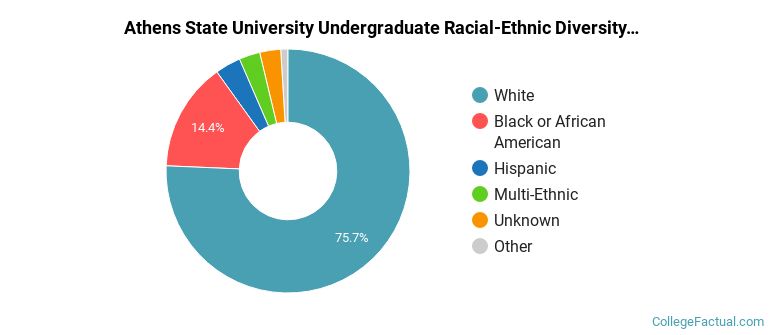
| Race/Ethnicity | Number |
|---|---|
| White | 2,139 |
| Black or African American | 416 |
| Hispanic | 103 |
| Unknown | 75 |
| Multi-Ethnic | 74 |
| Asian | 17 |
| Native Hawaiian or Pacific Islander | 3 |
| International | 2 |
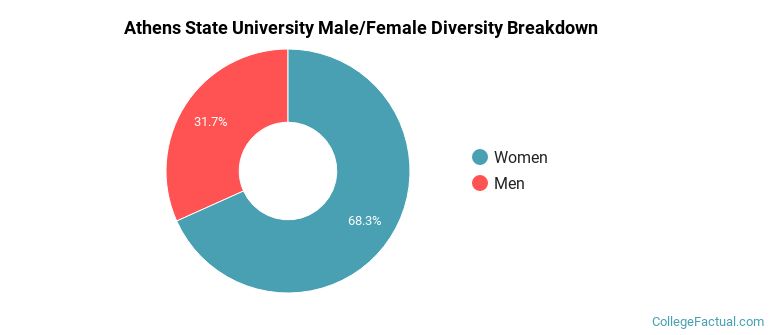
There are approximately 1,970 female students and 897 male students at Athens State University.
Students from 7 countries are represented at this school, with the majority of the international students coming from India, Colombia, and Nepal.
Learn more about international students at Athens State University.
A traditional college student is defined as being between the ages of 18-21. At Athens State University, 13.01% of students fall into that category, compared to the national average of 60%.
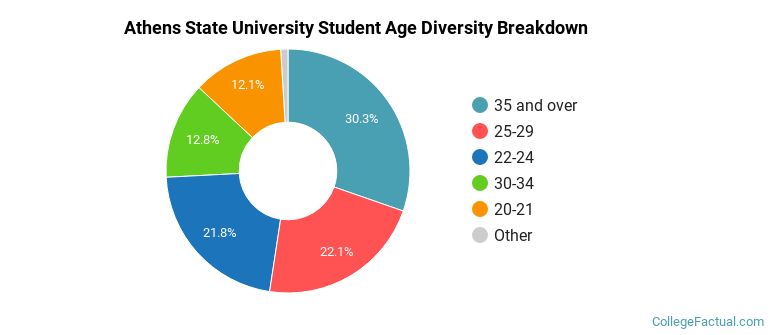
| Student Age Group | Amount |
|---|---|
| 35 and over | 943 |
| 25-29 | 687 |
| 22-24 | 677 |
| 30-34 | 398 |
| 20-21 | 375 |
| 18-19 | 30 |
| Under 18 | 0 |
Footnotes
*The racial-ethnic minorities count is calculated by taking the total number of students and subtracting white students, international students, and students whose race/ethnicity was unknown. This number is then divided by the total number of students at the school to obtain the racial-ethnic minorities percentage.
References
Department of Homeland Security Citizenship and Immigration Services
Read College Factual's Diversity Ranking Methodology.