Auburn total enrollment is approximately 30,737 students. 22,458 are undergraduates and 3,388 are graduate students.
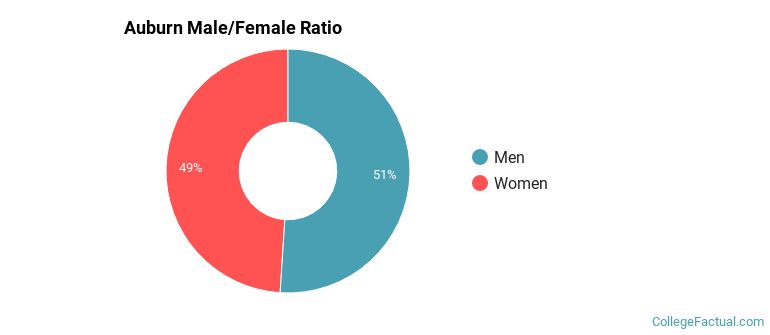
Male/Female Breakdown of Undergraduates
The full-time Auburn undergraduate population is made up of 49% women, and 51% men.
For the gender breakdown for all students, go here.
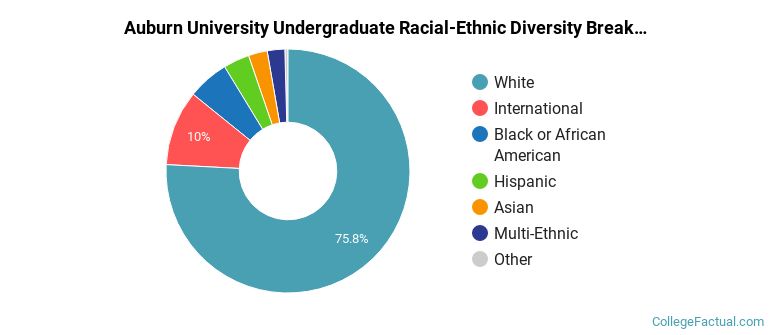
Auburn Racial/Ethnic Breakdown of Undergraduates

| Race/Ethnicity | Number |
|---|---|
| White | 18,187 |
| International | 1,249 |
| Black or African American | 1,003 |
| Hispanic | 778 |
| Multi-Ethnic | 589 |
| Asian | 532 |
| Unknown | 50 |
| Native Hawaiian or Pacific Islander | 12 |
See racial/ethnic breakdown for all students.
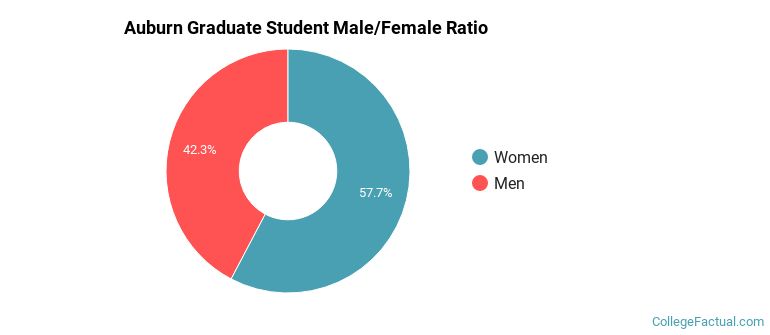
Male/Female Breakdown of Graduate Students
About 59% of full-time grad students are women, and 41% men.
For the gender breakdown for all students, go here.
Auburn Racial-Ethnic Breakdown of Graduate Students

| Race/Ethnicity | Number |
|---|---|
| White | 1,947 |
| International | 930 |
| Black or African American | 219 |
| Hispanic | 122 |
| Asian | 104 |
| Multi-Ethnic | 45 |
| Unknown | 13 |
| Native Hawaiian or Pacific Islander | 0 |
See racial/ethnic breakdown for all students.
| Race/Ethnicity | Number |
|---|---|
| White | 23,805 |
| International | 2,491 |
| Black or African American | 1,624 |
| Hispanic | 1,113 |
| Asian | 752 |
| Multi-Ethnic | 745 |
| Unknown | 98 |
| Native Hawaiian or Pacific Islander | 19 |

There are approximately 15,289 female students and 15,448 male students at Auburn.
Auburn ranks 448 out of 2,183 when it comes to geographic diversity.
39.65% of Auburn students come from out of state, and 1.7% come from out of the country.
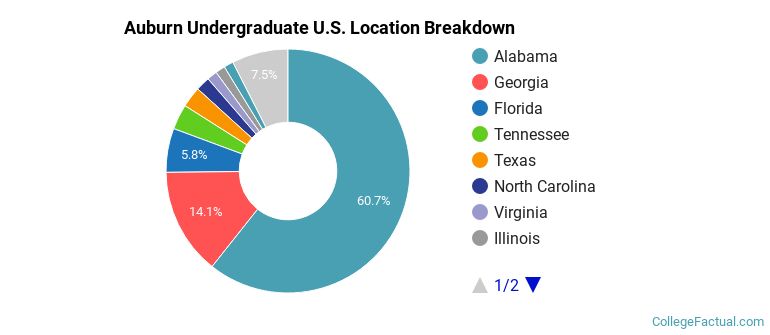
The undergraduate student body is split among 36 states (may include Washington D.C.). Click on the map for more detail.
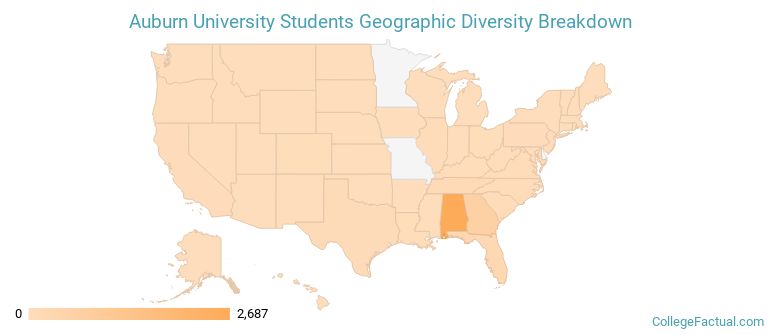
| State | Amount |
|---|---|
| Alabama | 2,687 |
| Georgia | 626 |
| Florida | 258 |
| Tennessee | 148 |
| Texas | 122 |
Students from 103 countries are represented at this school, with the majority of the international students coming from China, India, and Saudi Arabia.
Learn more about international students at Auburn.
A traditional college student is defined as being between the ages of 18-21. At Auburn, 65.41% of students fall into that category, compared to the national average of 60%.
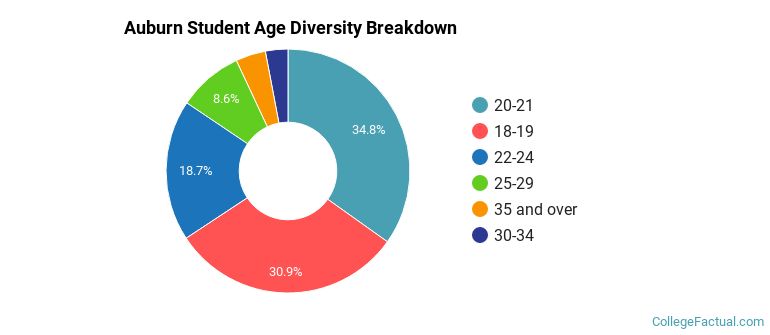
| Student Age Group | Amount |
|---|---|
| 20-21 | 10,327 |
| 18-19 | 9,149 |
| 22-24 | 5,547 |
| 25-29 | 2,552 |
| 35 and over | 1,180 |
| 30-34 | 884 |
| Under 18 | 0 |
Footnotes
*The racial-ethnic minorities count is calculated by taking the total number of students and subtracting white students, international students, and students whose race/ethnicity was unknown. This number is then divided by the total number of students at the school to obtain the racial-ethnic minorities percentage.
References
Department of Homeland Security Citizenship and Immigration Services
Image Credit: By Robert S. Donovan under License