Babson College total enrollment is approximately 3,340 students. 2,457 are undergraduates and 345 are graduate students.
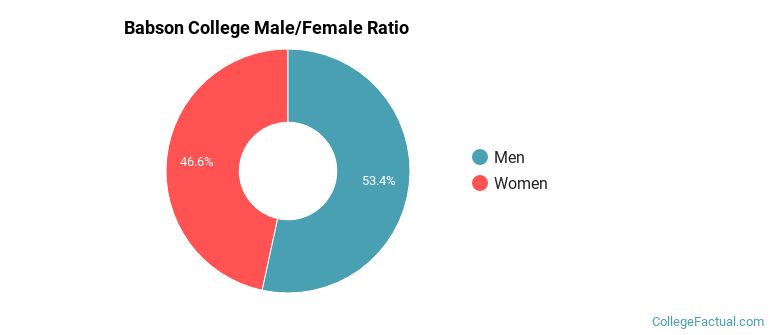
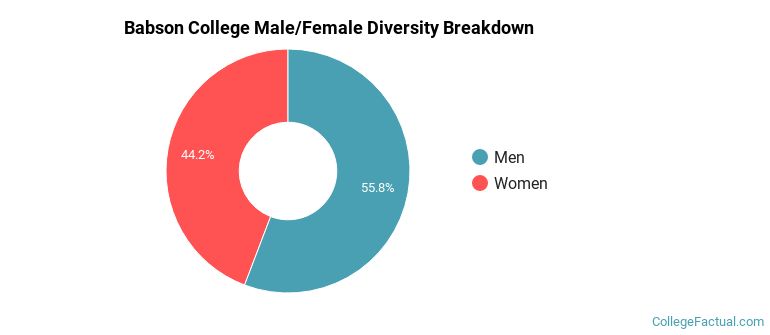
Male/Female Breakdown of Undergraduates
The full-time Babson College undergraduate population is made up of 45% women, and 55% men.
For the gender breakdown for all students, go here.
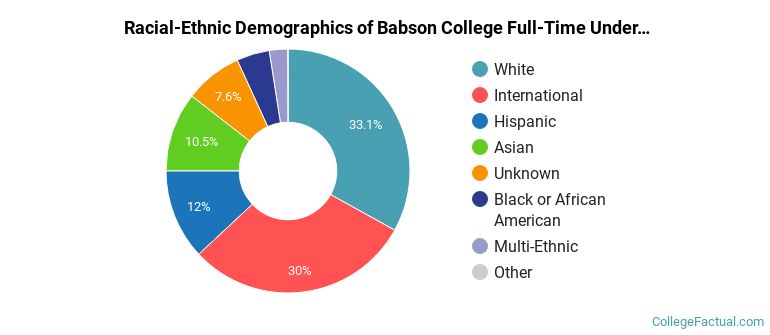
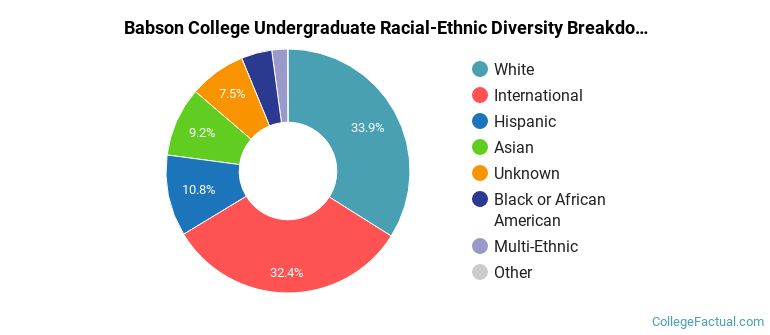
Babson College Racial/Ethnic Breakdown of Undergraduates
| Race/Ethnicity | Number |
|---|---|
| White | 858 |
| International | 655 |
| Hispanic | 330 |
| Asian | 287 |
| Unknown | 156 |
| Black or African American | 104 |
| Multi-Ethnic | 65 |
| Native Hawaiian or Pacific Islander | 1 |
See racial/ethnic breakdown for all students.
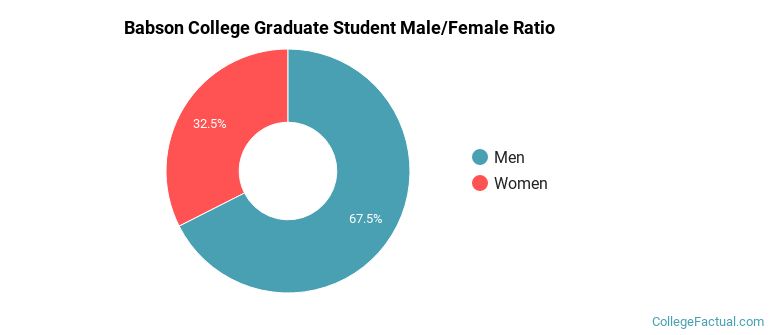
Male/Female Breakdown of Graduate Students
About 37% of full-time grad students are women, and 63% men.
For the gender breakdown for all students, go here.
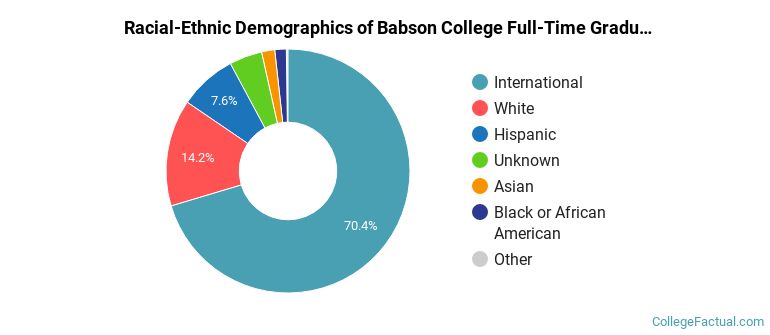
Babson College Racial-Ethnic Breakdown of Graduate Students
| Race/Ethnicity | Number |
|---|---|
| International | 158 |
| White | 108 |
| Hispanic | 27 |
| Asian | 20 |
| Unknown | 17 |
| Black or African American | 14 |
| Native Hawaiian or Pacific Islander | 1 |
| Multi-Ethnic | 0 |
See racial/ethnic breakdown for all students.
| Race/Ethnicity | Number |
|---|---|
| White | 1,273 |
| International | 852 |
| Hispanic | 394 |
| Asian | 362 |
| Unknown | 242 |
| Black or African American | 141 |
| Multi-Ethnic | 72 |
| Native Hawaiian or Pacific Islander | 3 |
There are approximately 1,473 female students and 1,867 male students at Babson College.
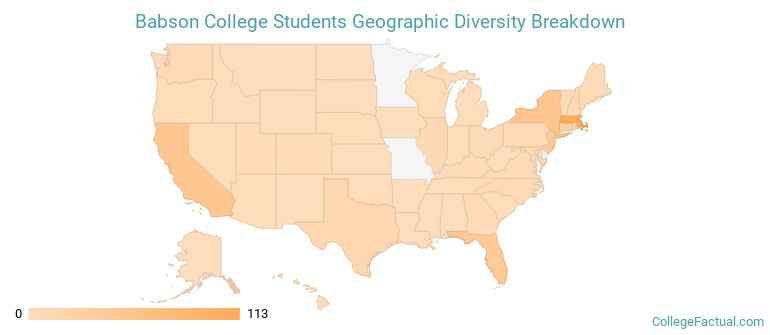
Babson College ranks 119 out of 2,183 when it comes to geographic diversity.
73.72% of Babson College students come from out of state, and 26.53% come from out of the country.
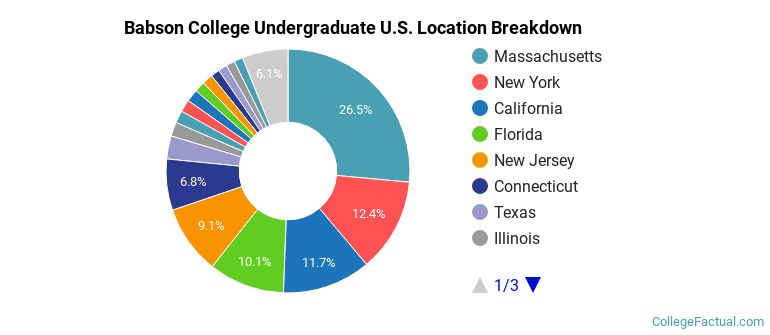
The undergraduate student body is split among 32 states (may include Washington D.C.). Click on the map for more detail.
| State | Amount |
|---|---|
| Massachusetts | 113 |
| New York | 53 |
| California | 50 |
| Florida | 43 |
| New Jersey | 39 |
Students from 91 countries are represented at this school, with the majority of the international students coming from India, China, and Thailand.
Learn more about international students at Babson College.
A traditional college student is defined as being between the ages of 18-21. At Babson College, 64.76% of students fall into that category, compared to the national average of 60%.
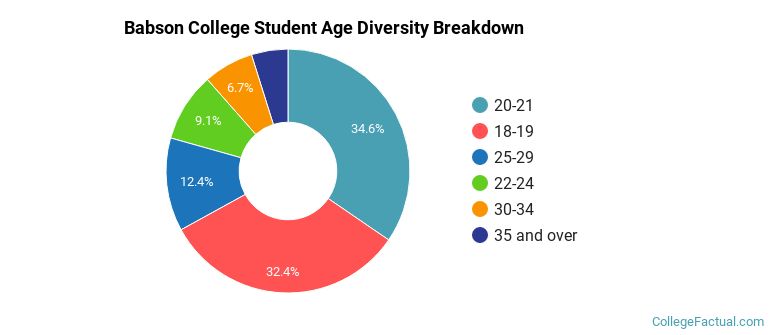
| Student Age Group | Amount |
|---|---|
| 20-21 | 1,112 |
| 18-19 | 1,044 |
| 25-29 | 398 |
| 22-24 | 294 |
| 30-34 | 214 |
| 35 and over | 156 |
| Under 18 | 0 |
Footnotes
*The racial-ethnic minorities count is calculated by taking the total number of students and subtracting white students, international students, and students whose race/ethnicity was unknown. This number is then divided by the total number of students at the school to obtain the racial-ethnic minorities percentage.
References