College Factual analyzes over 2,000 colleges and universities in its annual rankings and ranks them in a variety of ways, including most diverse, best overall quality, best for non-traditional students, and much more.
Baker University was awarded 8 badges in the 2025 rankings. The highest ranked major at the school is business administration & management.
Explore the best ranked schools for the programs you are most interested in.
According to College Factual's 2025 analysis, Baker is ranked #820 out of 2,152 schools in the nation that were analyzed for overall quality.
Baker also holds the #6 spot on the Best Colleges in Kansas ranking.
With an acceptance rate of 92%, Baker has a fairly liberal admissions policy. However, don't just assume you'll get in! Put together a good application and make sure you include all requested documents and materials.
About 1% of students accepted to Baker submitted their SAT scores.Baker received ACT scores from 6% of accepted students. When looking at the 25th through the 75th percentile, ACT Composite scores ranged between 17 and 23.
The student to faculty ratio is often used to estimate how much interaction there is between professors and their students at a college or university. At Baker University, this ratio is 13 to 1, which is on par with the national average of 15 to 1. That's not bad at all.
Another measure that is often used to estimate how much access students will have to their professors is how many faculty members are full-time. The idea here is that part-time faculty tend to spend less time on campus, so they may not be as available to students as full-timers.
The full-time faculty percentage at Baker University is 22%. This is lower than the national average of 47%.
The freshmen retention rate of 80% tells us that most first-year, full-time students like Baker University enough to come back for another year. This is a fair bit higher than the national average of 68%. That's certainly something to check off in the good column about the school.
The on-time graduation rate for someone pursuing a bachelor's degree is typically four years. This rate at Baker for first-time, full-time students is 50%, which is better than the national average of 33.3%.
Find out more about the retention and graduation rates at Baker University.
During the 2017-2018 academic year, there were 1,335 undergraduates at Baker with 1,083 being full-time and 252 being part-time.
| $0-30 K | $30K-48K | $48-75 | $75-110K | $110K + |
|---|---|---|---|---|
| $13,810 | $19,748 | $20,606 | $24,437 | $26,736 |
The net price is calculated by adding tuition, room, board and other costs and subtracting financial aid.Note that the net price is typically less than the published for a school. For more information on the sticker price of Baker, see our tuition and fees and room and board pages.
It's not uncommon for college students to take out loans to pay for school. In fact, almost 66% of students nationwide depend at least partially on loans. At Baker, approximately 67% of students took out student loans averaging $7,855 a year. That adds up to $31,420 over four years for those students.
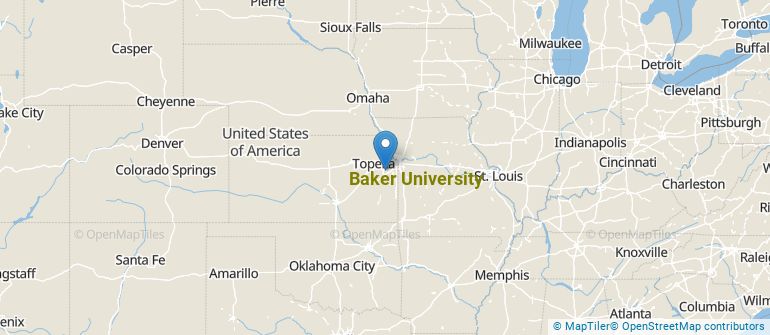
Get more details about the location of Baker University.
Contact details for Baker are given below.
| Contact Details | |
|---|---|
| Address: | 615 Dearborn Street, Baldwin City, KS 66006-0065 |
| Phone: | 785-594-6451 |
| Website: | https://www.bakeru.edu/ |
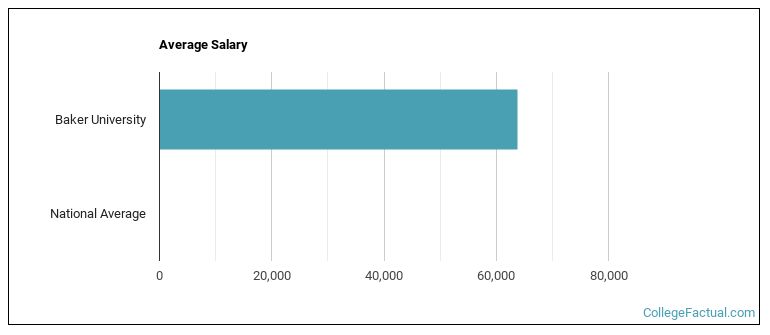
| Most Popular Majors | Bachelor’s Degrees | Average Salary of Graduates |
|---|---|---|
| Business Administration & Management | 256 | $59,145 |
| Educational Administration | 79 | NA |
| Nursing | 74 | $70,720 |
| General Education | 67 | NA |
| Health & Physical Education | 47 | NA |
| General Business/Commerce | 43 | NA |
| General Psychology | 20 | NA |
| Teacher Education Grade Specific | 15 | NA |
| Communication & Media Studies | 11 | NA |
| Special Education | 11 | NA |
Online learning is becoming popular at even the oldest colleges and universities in the United States. Not only are online classes great for returning adults with busy schedules, they are also frequented by a growing number of traditional students.
In 2022-2023, 791 students took at least one online class at Baker University. This is a decrease from the 1,034 students who took online classes the previous year.
| Year | Took at Least One Online Class | Took All Classes Online |
|---|---|---|
| 2022-2023 | 791 | 768 |
| 2021-2022 | 1,034 | 1,034 |
| 2020-2021 | 1,419 | 1,197 |
| 2018-2019 | 1,002 | 671 |
If you’re considering Baker University, here are some more schools you may be interested in knowing more about.
Curious on how these schools stack up against Baker? Pit them head to head with College Combat, our free interactive tool that lets you compare college on the features that matter most to you!
Footnotes
*The racial-ethnic minorities count is calculated by taking the total number of students and subtracting white students, international students, and students whose race/ethnicity was unknown. This number is then divided by the total number of students at the school to obtain the racial-ethnic minorities percentage.
References
More about our data sources and methodologies.