Here is an overview of this program at BSU. It is offered at the Bachelor’s level, with graduate study also available. Its best result is a rank of #4 out of 14 schools (Bachelor’s level) by College Factual. Jump to any of the following sections:
By College Factual’s measure, BSU as a strong choice for teacher education subject specific, coming in at #99 out of 554 schools nationally.
The table below lists every degree level granted in teacher education subject specific at BSU, along with how many graduates complete each level annually.
| Degree Level | Annual Graduates |
|---|---|
| Bachelor’s | 139 |
| Master’s | 52 |
| Graduate Certificate | 4 |
In the most recent year for which we have data, Ball State University handed out 139 bachelor’s degrees in teacher education subject specific.
BSU is among the very best schools in the country for teacher education subject specific at the bachelor’s level. Specifically, it ranked #4 out of 14 schools by College Factual.
Teacher Education Subject Specific students who finish a bachelor’s at BSU earn a median of $48,243 a year. This is lower than $53,575, the median for all majors at BSU.
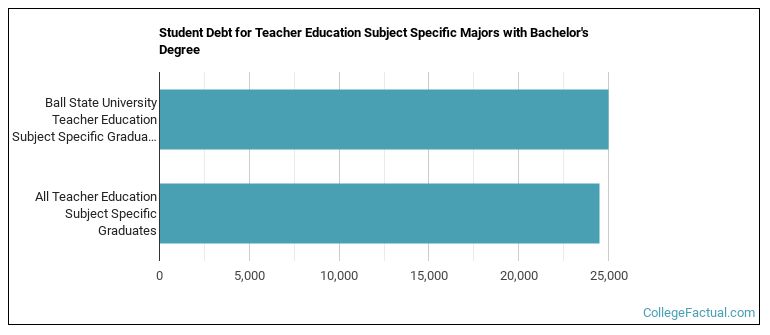
While getting their bachelor’s degree at BSU, teacher education subject specific students accumulate a median of $24,998 in student loans. This is above $24,488, the typical median for all majors at BSU.
The full-time undergraduate tuition and fees are shown below.
| In State | Out of State | |
|---|---|---|
| Tuition | $9,628 | $27,496 |
| Fees | $2,134 | $2,134 |
Learn more about BSU tuition and fees.
Among recent graduates, 40% of teacher education subject specific bachelor’s degrees went to men and 60% went to women.
 The majority of teacher education subject specific bachelor’s degree graduates at BSU were White. Approximately 81% of graduates fell into this category.
The following table and chart show the ethnic background for students who recently graduated from Ball State University with a bachelor’s in teacher education subject specific.

| Ethnic Background | Number of Students |
|---|---|
| Asian | 6 |
| Black or African American | 2 |
| Hispanic or Latino | 8 |
| White | 113 |
| Non-Resident Aliens | 1 |
| Other Races | 9 |
BSU conferred 33 bachelor’s completions in music teacher education in the latest year of data — 55% to women and 45% to men. The largest share of these graduates were White (82%).
BSU awarded 32 bachelor’s completions in social studies teacher education in the most recent reporting year — 41% to women and 59% to men. The largest share of these graduates were White (84%).
BSU granted 15 bachelor’s completions in english/language arts teacher education in the most recent reporting year — 80% to women and 20% to men. Most of these graduates identified as White (80%).
BSU awarded 14 bachelor’s completions in art teacher education in the most recent reporting year — 100% to women and 0% to men. The most common background among these graduates was White (79%).
BSU granted 14 bachelor’s degrees in physical education teaching and coaching in the most recent reporting year — 36% to women and 64% to men. Most of these graduates identified as White (71%).
BSU conferred 13 bachelor’s completions in drama and dance teacher education in the latest year of data — 54% to women and 46% to men. The largest share of these graduates were White (77%).
BSU granted 7 bachelor’s completions in mathematics teacher education recently — 57% to women and 43% to men. The most common background among these graduates was White (86%).
BSU awarded 4 bachelor’s completions in biology teacher education recently — 100% to women and 0% to men. The most common background among these graduates was White (75%).
BSU granted 3 bachelor’s completions in spanish language teacher education recently — 67% to women and 33% to men. The largest share of these graduates were White (100%).
BSU awarded 2 bachelor’s completions in german language teacher education in the latest year of data — 100% to women and 0% to men. The largest share of these graduates were White (100%).
BSU conferred 2 bachelor’s degrees in teacher education and professional development, specific subject areas, other in the most recent reporting year — 100% to women and 0% to men. Most of these graduates identified as White (100%).
Graduate study is also available at BSU. The following graduate award levels are reported.
| Graduate Level | Annual Graduates |
|---|---|
| Master’s Degrees in Teacher Education Subject Specific | 52 |
| Graduate Certificate Degrees in Teacher Education Subject Specific | 4 |
