Here, you'll find out more about the major, including such details as the number of graduates, what degree levels are offered, ethnicity of students, average salaries, and more. In addition, we cover how Ball State ranks in comparison to other schools with subject specific ed programs.
Jump to any of the following sections:
In College Factual's most recent rankings for the best schools for subject specific ed majors, Ball State came in at #9. This puts it in the top 5% of the country in this field of study. It is also ranked #1 in Indiana.
During the 2021-2022 academic year, Ball State University handed out 134 bachelor's degrees in teacher education subject specific. This is a decrease of 1% over the previous year when 136 degrees were handed out.
In 2022, 61 students received their master’s degree in subject specific ed from Ball State. This makes it the #62 most popular school for subject specific ed master’s degree candidates in the country.
In addition, 1 students received their doctoral degrees in subject specific ed in 2022, making the school the #61 most popular school in the United States for this category of students.
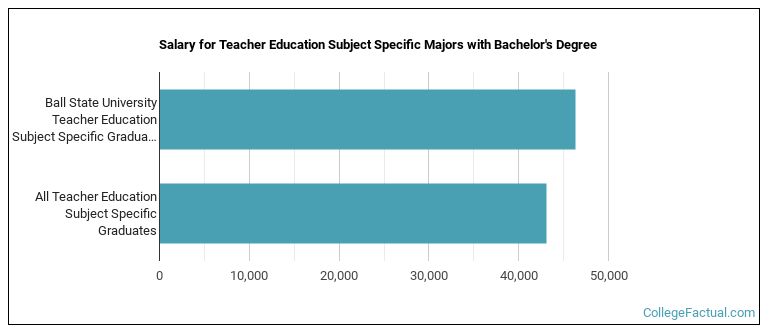
The median salary of subject specific ed students who receive their bachelor's degree at Ball State is $46,347. This is great news for graduates of the program, since this figure is higher than the national average of $43,086 for all subject specific ed bachelor's degree recipients.
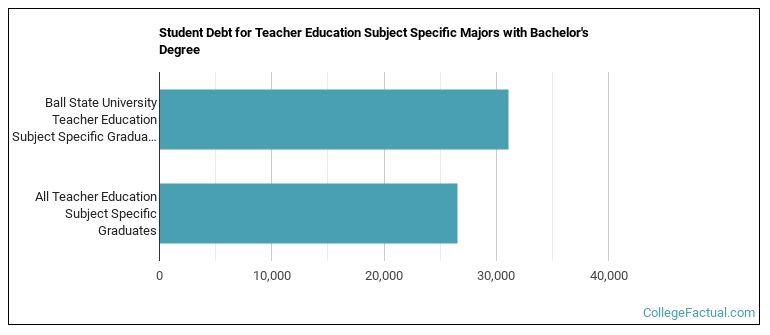
While getting their bachelor's degree at Ball State, subject specific ed students borrow a median amount of $31,107 in student loans. This is higher than the the typical median of $26,530 for all subject specific ed majors across the country.
The typical student loan payment of a bachelor's degree student from the subject specific ed program at Ball State is $288 per month.
During the 2022-2023 academic year, part-time undergraduate students at Ball State paid an average of $1,118 per credit hour if they came to the school from out-of-state. In-state students paid a discounted rate of $336 per credit hour. The following table shows the average full-time tuition and fees for undergraduates.
| In State | Out of State | |
|---|---|---|
| Tuition | $8,688 | $26,696 |
| Fees | $2,070 | $2,070 |
| Books and Supplies | $1,360 | $1,360 |
| On Campus Room and Board | $12,064 | $12,064 |
| On Campus Other Expenses | $2,552 | $2,552 |
Learn more about Ball State tuition and fees.
Of the 134 students who earned a bachelor's degree in Teacher Education Subject Specific from Ball State in 2021-2022, 47% were men and 53% were women.

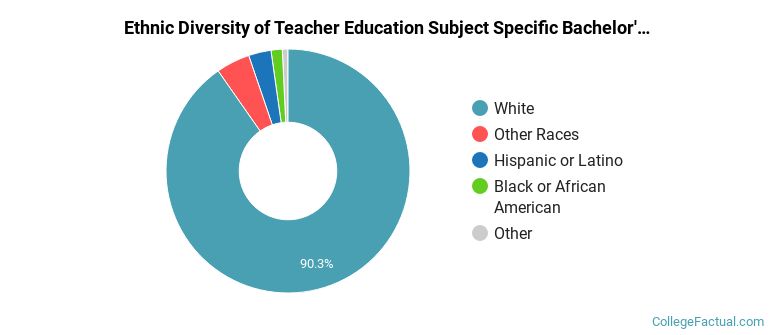
The majority of the students with this major are white. About 90% of 2022 graduates were in this category.
The following table and chart show the ethnic background for students who recently graduated from Ball State University with a bachelor's in subject specific ed.
| Ethnic Background | Number of Students |
|---|---|
| Asian | 1 |
| Black or African American | 2 |
| Hispanic or Latino | 4 |
| White | 121 |
| Non-Resident Aliens | 0 |
| Other Races | 6 |
Ball State does not offer an online option for its subject specific ed bachelor’s degree program at this time. To see if the school offers distance learning options in other areas, visit the Ball State Online Learning page.
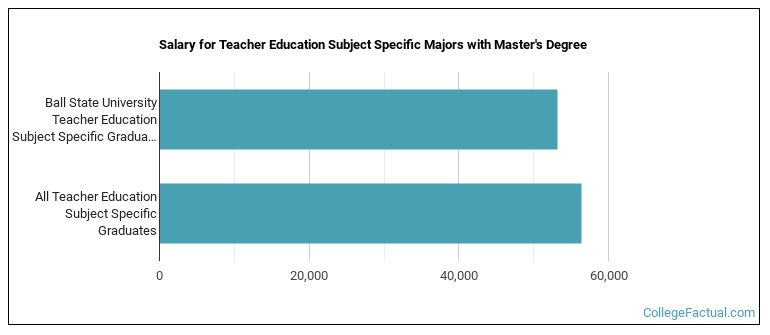
Subject Specific Ed majors graduating with a master's degree from Ball State make a median salary of $53,142 a year. This is less than what their typical peers from other schools make. Their median salary is $56,457.
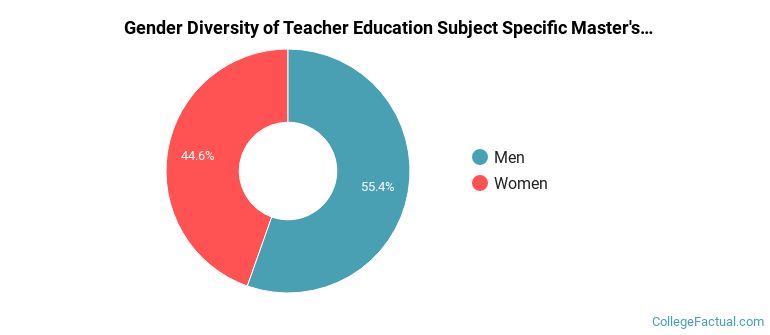
In the 2021-2022 academic year, 74 students earned a master's degree in subject specific ed from Ball State. About 45% of these graduates were women and the other 55% were men.
The majority of the students with this major are white. About 86% of 2022 graduates were in this category.
The following table and chart show the ethnic background for students who recently graduated from Ball State University with a master's in subject specific ed.
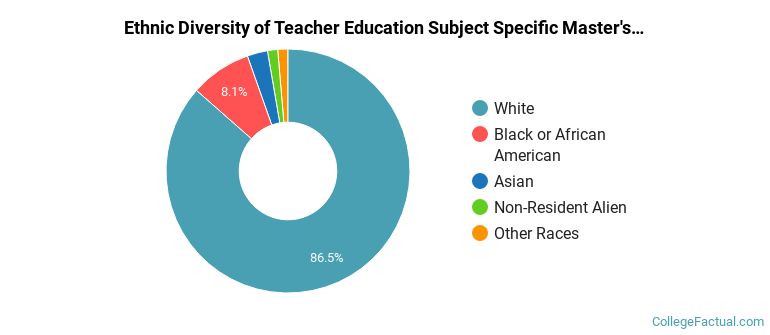
| Ethnic Background | Number of Students |
|---|---|
| Asian | 2 |
| Black or African American | 6 |
| Hispanic or Latino | 0 |
| White | 64 |
| Non-Resident Aliens | 1 |
| Other Races | 1 |
Take a look at the following statistics related to the make-up of the subject specific ed majors at Ball State University.
| Related Major | Annual Graduates |
|---|---|
| Special Education | 1,841 |
| Teacher Education Grade Specific | 261 |
| Educational Administration | 135 |
| Student Counseling | 35 |
| Curriculum & Instruction | 26 |
View All Teacher Education Subject Specific Related Majors >
More about our data sources and methodologies.