ADBLOCK #102
College Factual  by our College Data Analytics Team
       Unbiased Factual Guarantee

Bard College at Simon’s Rock Data & Information Overview

36 awards Ranking Badges
80% Acceptance Rate
4% Student Loan Default Rate
This overview covers the essential stats on Bard College at Simon’s Rock, including its rankings, majors, diversity, and more.
ADBLOCK #159
If you’re interested in learning more about a particular stat, just click on its tile to go to a new page that covers the topic more in-depth. Also, you can jump to any section of this page by clicking one of the links below.

ADBLOCK #145
ADBLOCK #147

How Well Is Bard College at Simon’s Rock Ranked?

2023 Rankings

In its yearly rankings, College Factual analyzes over 2,000 colleges and universities to determine which ones are the best in a variety of categories, such as overall value, quality, diversity, which schools are the best for each major, and much more.

Bard College at Simon's Rock was awarded 36 badges in the 2023 rankings.

ADBLOCK #150

Explore Best Ranked Schools for You

Explore the best ranked schools for the programs you are most interested in.

ADBLOCK #153

Overall Quality

Simon's Rock was not ranked in College Factual's 2023 Best Overall Colleges report. This could be for a number of reasons, including lack of data.

See all of the rankings for Bard College at Simon's Rock.

ADBLOCK #154

Is It Hard to Get Into Simon’s Rock?

80% Acceptance Rate
65% Of Accepted Are Women

Acceptance Rate

The acceptance rate at Bard College at Simon's Rock is 80%. That's higher than the rate at many schools, but still low enough to be considered somewhat selective. If you want to get in, you'll need good grades and to be able to show that Simon's Rock is a good fit for you.

ADBLOCK #171

Learn more about Bard College at Simon’s Rock admissions.

ADBLOCK #603

Bard College at Simon’s Rock Faculty

6 to 1 Student to Faculty
67% Full Time Teachers

Student to Faculty Ratio

The student to faculty ratio is often used to measure the number of teaching resources that a college or university offers its students. The national average for this metric is 15 to 1, but at Simon's Rock it is much better at 6 to 1. That's good news for students who want to interact more on a personal level with their teachers.

ADBLOCK #172

Percent of Full-Time Faculty

When estimating how much access students will have to their teachers, some people like to look at what percentage of faculty members are full time. This is because part-time teachers may not have as much time to spend on campus as their full-time counterparts.

The full-time faculty percentage at Bard College at Simon's Rock is 67%. This is higher than the national average of 47%.

Full-Time Faculty Percent  67 out of 100
0
100
ADBLOCK #173

Retention and Graduation Rates at Bard College at Simon’s Rock

75% Freshmen Retention

Freshmen Retention Rate

Bard College at Simon's Rock has a freshmen retention rate of 75%. That's a good sign that full-time students like the school and their professors enough to want to stick around for another year. It's also a sign that the admissions team did a good job in choosing applicants who were a good fit for the school.

Freshmen Retention Rate  75 out of 100
0
100
ADBLOCK #174

Find out more about the retention and graduation rates at Bard College at Simon’s Rock.

ADBLOCK #175

Bard College at Simon’s Rock Undergraduate Student Diversity

328 Full-Time Undergraduates
24.1% Racial-Ethnic Minorities*
63.7% Percent Women

During the 2017-2018 academic year, there were 343 undergraduates at Simon's Rock with 328 being full-time and 15 being part-time.

ADBLOCK #604

How Much Does Bard College at Simon’s Rock Cost?

$42,843 Net Price
62% Take Out Loans
$33,516 Total Student Loans
The overall average net price of Simon's Rock is $42,843. The affordability of the school largely depends on your financial need since net price varies by income group. See the table below for the net price for different income groups.

Net Price by Income Group for Simon’s Rock

$0-30 K $30K-48K $48-75 $75-110K $110K +
$25,414 $25,831 $29,382 $30,277 $72,175

The net price is calculated by adding tuition, room, board and other costs and subtracting financial aid.Note that the net price is typically less than the published for a school. For more information on the sticker price of Simon's Rock, see our tuition and fees and room and board pages.

ADBLOCK #176

Student Loan Debt

While almost two-thirds of students nationwide take out loans to pay for college, the percentage may be quite different for the school you plan on attending. At Simon's Rock, approximately 62% of students took out student loans averaging $8,379 a year. That adds up to $33,516 over four years for those students.

The student loan default rate at Simon's Rock is 4.1%. This is significantly lower than the national default rate of 10.1%, which is a good sign that you'll be able to pay back your student loans.

Get more details about paying for Bard College at Simon’s Rock.

ADBLOCK #177

How Much Money Do Simon’s Rock Graduates Make?

$37,980 Avg Salary of Grads
High Earnings Boost
The pay for some majors is higher than others, but on average, students who graduate with a bachelor's degree from Simon's Rock make about $37,980 a year during their first few years of employment after graduation. This is in the same neighborhood of the average college graduate's salary of $42,485 per year. However, certain majors may produce higher-paying graduates.

undefined

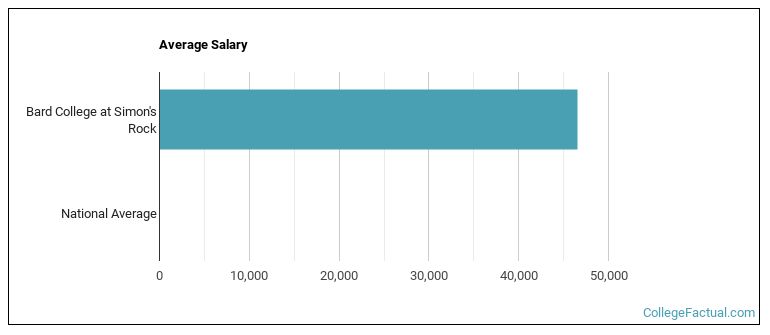
See which majors at Bard College at Simon’s Rock make the most money.

ADBLOCK #178

Location of Bard College at Simon’s Rock

Massachusetts State
328 Full-Time Undergraduates
Town Campus Setting
Located in Great Barrington, Massachusetts, Bard College at Simon's Rock is a private not-for-profit institution. The location of Simon's Rock is a good match for students who are interested in living in a college town while they pursue their degree.

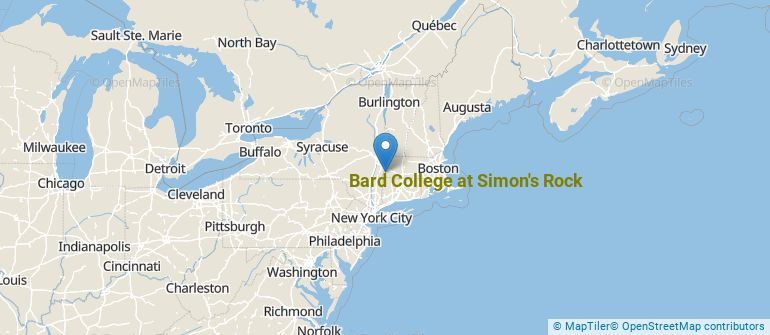
Get more details about the location of Bard College at Simon’s Rock.

undefined

Contact details for Simon's Rock are given below.

Contact Details
Address: 84 Alford Road, Great Barrington, MA 01230-9702
Phone: 413-644-4400
Website: www.simons-rock.edu/
ADBLOCK #605

Bard College at Simon’s Rock Majors

41 Majors With Completions
133 Undergraduate Degrees
151 Graduate Degrees
During the most recent year for which we have data, students from 41 majors graduated from Bard College at Simon's Rock. Of these students, 133 received undergraduate degrees and 151 graduated with a master's or doctor's degree. The following table lists the most popular undergraduate majors along with the average salary graduates from those majors make.

Most Popular Majors Bachelor’s Degrees Average Salary of Graduates
Film, Video & Photographic Arts 4 NA
Multicultural & Diversity Studies 3 NA
General Psychology 3 NA
Fine & Studio Arts 3 NA
Computer Science 3 NA
Political Science & Government 3 NA
Natural Resources Conservation 3 NA
Other Social Sciences 2 NA
Mathematics 2 NA
Ethnic Studies 2 NA

Learn more about the majors offered at Bard College at Simon's Rock along with which ones have the highest average starting salaries.

ADBLOCK #179

Online Learning at Simon’s Rock

47% Take At Least One Class Online
3% Take All Classes Online

Online courses area a great option for busy, working students as well as for those who have scheduling conflicts and want to study on their own time. As time goes by, expect to see more and more online learning options become available.

In 2019-2020, 160 students took at least one online class at Bard College at Simon's Rock. This is an increase from the 0 students who took online classes the previous year.

Year Took at Least One Online Class Took All Classes Online
2019-2020 160 9
2018-2019 0 0
2017-2018 0 0
2016-2017 0 0
2015-2016 0 0

Learn more about online learning at Bard College at Simon’s Rock.

ADBLOCK #180

ADBLOCK #606

ADBLOCK #181

Notes and References

Footnotes

*The racial-ethnic minorities count is calculated by taking the total number of students and subtracting white students, international students, and students whose race/ethnicity was unknown. This number is then divided by the total number of students at the school to obtain the racial-ethnic minorities percentage.

References

More about our data sources and methodologies.

ADBLOCK #115

Popular Reports

College Rankings
Best by Location
Degree Guides by Major
Graduate Programs
ADBLOCK #613

Compare Your School Options