Belhaven total enrollment is approximately 4,999 students. 1,177 are undergraduates and 318 are graduate students.
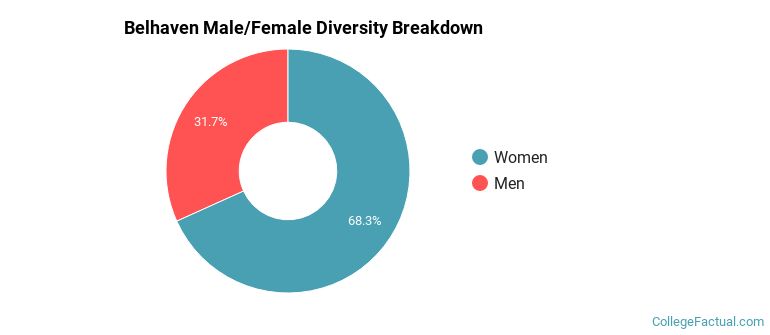
Male/Female Breakdown of Undergraduates
The full-time Belhaven undergraduate population is made up of 61% women, and 39% men.
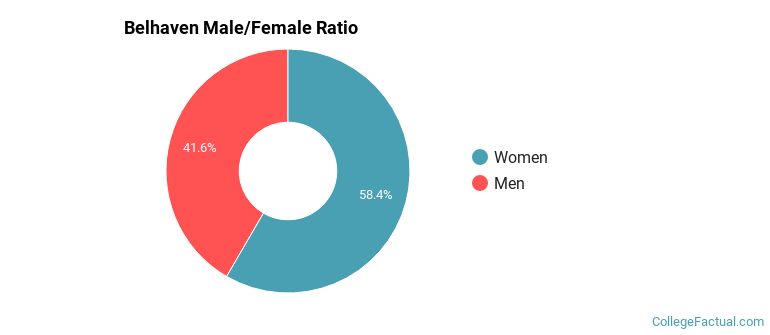
For the gender breakdown for all students, go here.
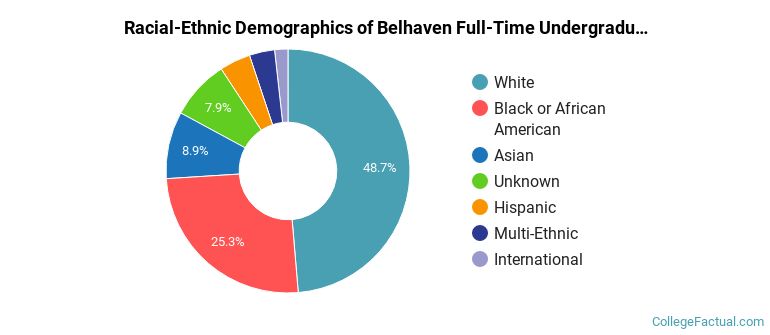
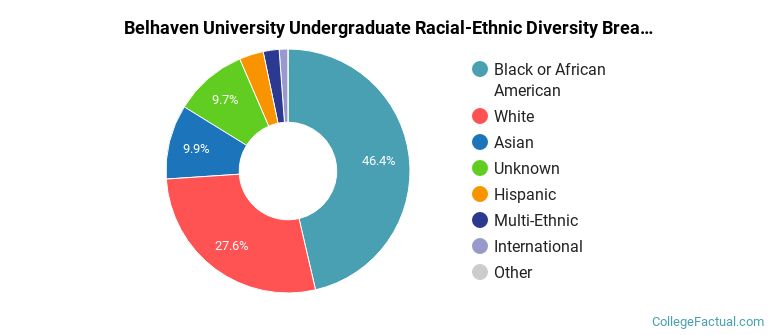
Belhaven Racial/Ethnic Breakdown of Undergraduates
| Race/Ethnicity | Number |
|---|---|
| White | 566 |
| Black or African American | 383 |
| Unknown | 60 |
| Asian | 59 |
| Hispanic | 46 |
| Multi-Ethnic | 39 |
| International | 15 |
| Native Hawaiian or Pacific Islander | 0 |
See racial/ethnic breakdown for all students.
Male/Female Breakdown of Graduate Students
About 56% of full-time grad students are women, and 44% men.
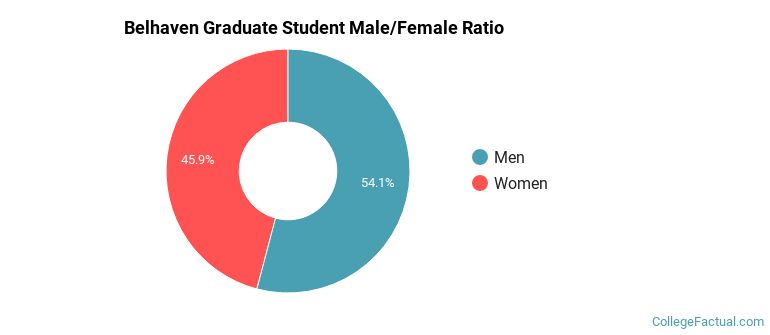
For the gender breakdown for all students, go here.
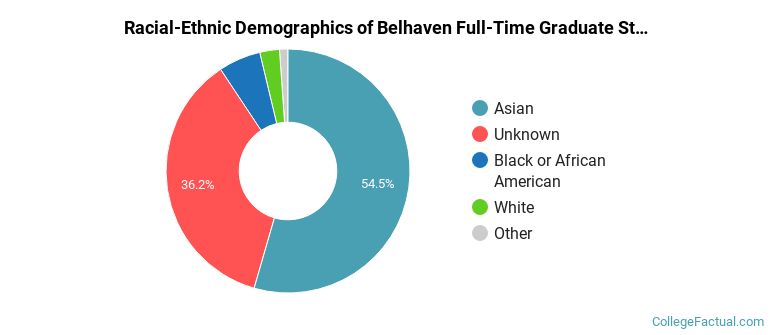
Belhaven Racial-Ethnic Breakdown of Graduate Students
| Race/Ethnicity | Number |
|---|---|
| Asian | 240 |
| Unknown | 42 |
| Black or African American | 20 |
| White | 15 |
| Hispanic | 0 |
| Native Hawaiian or Pacific Islander | 0 |
| International | 0 |
| Multi-Ethnic | 0 |
See racial/ethnic breakdown for all students.
| Race/Ethnicity | Number |
|---|---|
| Black or African American | 2,646 |
| White | 1,169 |
| Asian | 548 |
| Unknown | 362 |
| Hispanic | 128 |
| Multi-Ethnic | 100 |
| International | 22 |
| Native Hawaiian or Pacific Islander | 3 |
There are approximately 3,530 female students and 1,469 male students at Belhaven.
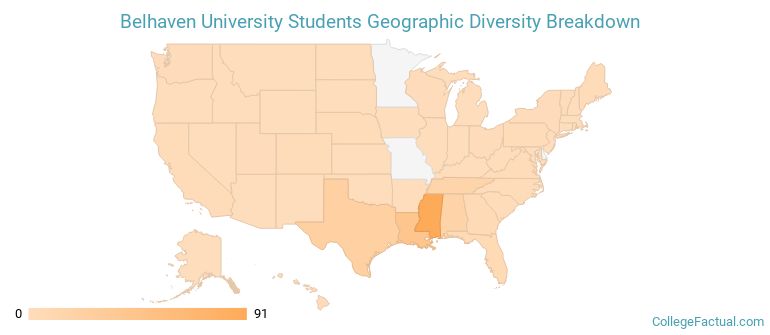
Belhaven ranks 437 out of 2,183 when it comes to geographic diversity.
59.75% of Belhaven students come from out of state, and 0% come from out of the country.
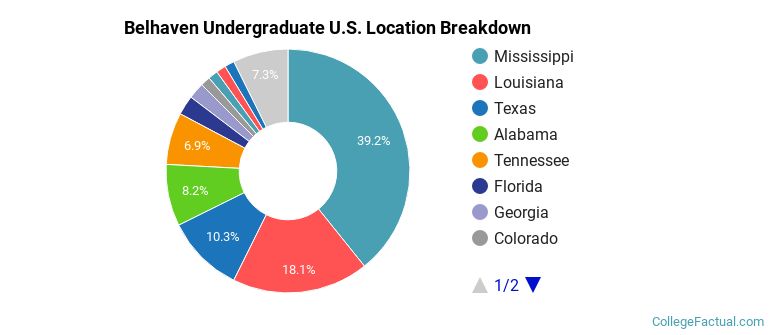
The undergraduate student body is split among 23 states (may include Washington D.C.). Click on the map for more detail.
| State | Amount |
|---|---|
| Mississippi | 91 |
| Louisiana | 42 |
| Texas | 24 |
| Alabama | 19 |
| Tennessee | 16 |
Students from 32 countries are represented at this school, with the majority of the international students coming from China, United Kingdom, and South Korea.
Learn more about international students at Belhaven.
A traditional college student is defined as being between the ages of 18-21. At Belhaven, 16.40% of students fall into that category, compared to the national average of 60%.
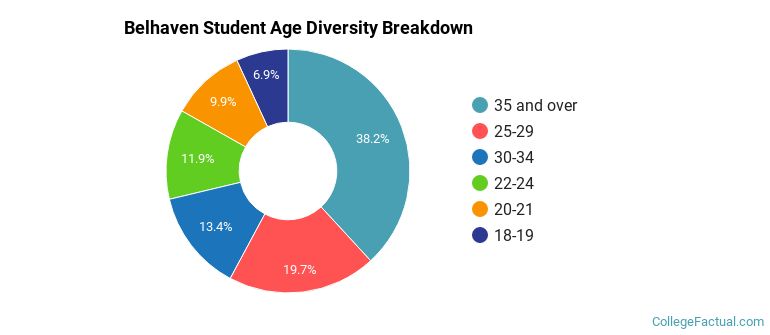
| Student Age Group | Amount |
|---|---|
| 35 and over | 1,660 |
| 25-29 | 857 |
| 30-34 | 584 |
| 22-24 | 519 |
| 20-21 | 431 |
| 18-19 | 300 |
| Under 18 | 0 |
Footnotes
*The racial-ethnic minorities count is calculated by taking the total number of students and subtracting white students, international students, and students whose race/ethnicity was unknown. This number is then divided by the total number of students at the school to obtain the racial-ethnic minorities percentage.
References
Department of Homeland Security Citizenship and Immigration Services
Image Credit: By David Lazich under License