Here, you'll find out more about the major, including such details as the number of graduates, what degree levels are offered, ethnicity of students, and more. In addition, we cover how BC ranks in comparison to other schools with allied health programs.
Go directly to any of the following sections:
Learn about start dates, transferring credits, availability of financial aid, and more by contacting the universities below.
Take your associate degree in an allied health field to the next level with this specialized transfer friendly online bachelor of science from Southern New Hampshire University.
In College Factual's most recent rankings for the best schools for allied health majors, BC came in at #42. This puts it in the top 5% of the country in this field of study. It is also ranked #3 in Washington.
| Ranking Type | Rank |
|---|---|
| Best Allied Health Professions Associate Degree Schools | 16 |
| Best Allied Health Professions Schools | 42 |
During the 2021-2022 academic year, Bellevue College handed out 16 bachelor's degrees in allied health professions. This is an increase of 33% over the previous year when 12 degrees were handed out.
In 2022-2023, the average part-time undergraduate tuition at BC was $295 per credit hour for out-of-state students. The average for in-state students was $118 per credit hour. Information about average full-time undergraduate tuition and fees is shown in the table below.
| In State | Out of State | |
|---|---|---|
| Tuition | $4,074 | $9,952 |
| Fees | $231 | $231 |
| Books and Supplies | $762 | $762 |
| On Campus Room and Board | $19,422 | $19,422 |
| On Campus Other Expenses | $3,750 | $3,750 |
Learn more about BC tuition and fees.
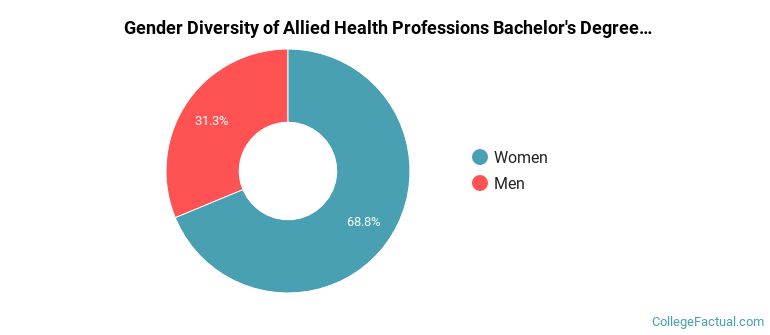
Of the 16 students who graduated with a Bachelor’s in allied health from BC in 2022, 31% were men and 69% were women.
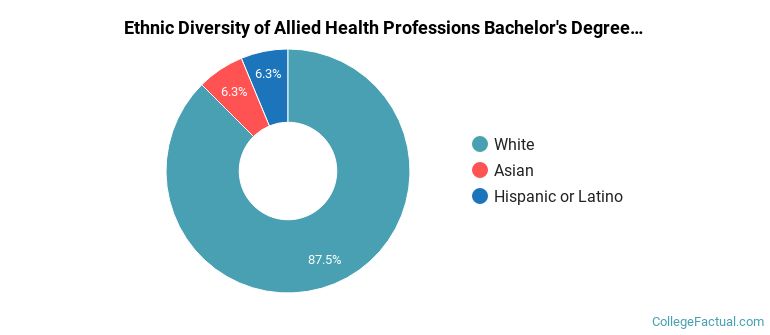
The majority of bachelor's degree recipients in this major at BC are white. In the most recent graduating class for which data is available, 88% of students fell into this category.
The following table and chart show the ethnic background for students who recently graduated from Bellevue College with a bachelor's in allied health.
| Ethnic Background | Number of Students |
|---|---|
| Asian | 1 |
| Black or African American | 0 |
| Hispanic or Latino | 1 |
| White | 14 |
| Non-Resident Aliens | 0 |
| Other Races | 0 |
Online degrees for the BC allied health bachelor’s degree program are not available at this time. To see if the school offers distance learning options in other areas, visit the BC Online Learning page.
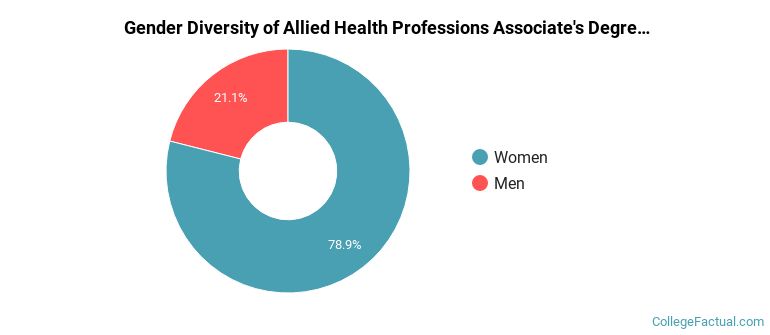
During the 2021-2022 academic year, 76 students graduated with a associate's degree in allied health from BC. About 21% were men and 79% were women.
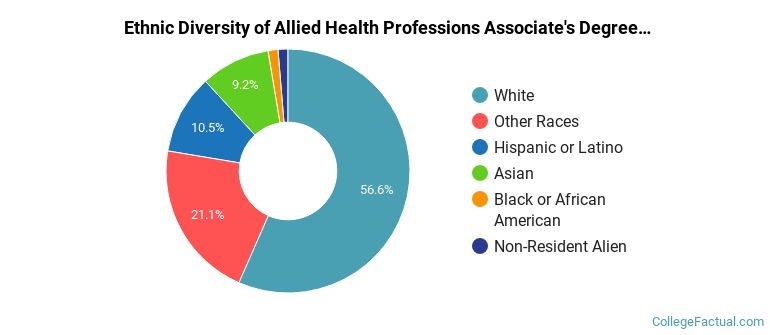
The majority of associate's degree recipients in this major at BC are white. In the most recent graduating class for which data is available, 57% of students fell into this category.
The following table and chart show the ethnic background for students who recently graduated from Bellevue College with a associate's in allied health.
| Ethnic Background | Number of Students |
|---|---|
| Asian | 7 |
| Black or African American | 1 |
| Hispanic or Latino | 8 |
| White | 43 |
| Non-Resident Aliens | 1 |
| Other Races | 16 |
Take a look at the following statistics related to the make-up of the allied health majors at Bellevue College.
| Related Major | Annual Graduates |
|---|---|
| Nursing | 89 |
| Health & Medical Administrative Services | 70 |
| Health Sciences & Services | 26 |
| Allied Health & Medical Assisting Services | 17 |
| Clinical/Medical Laboratory Science | 4 |
