Bellevue University total enrollment is approximately 13,059 students. 6,302 are undergraduates and 2,498 are graduate students.
Male/Female Breakdown of Undergraduates
The full-time Bellevue University undergraduate population is made up of 52% women, and 48% men.
For the gender breakdown for all students, go here.
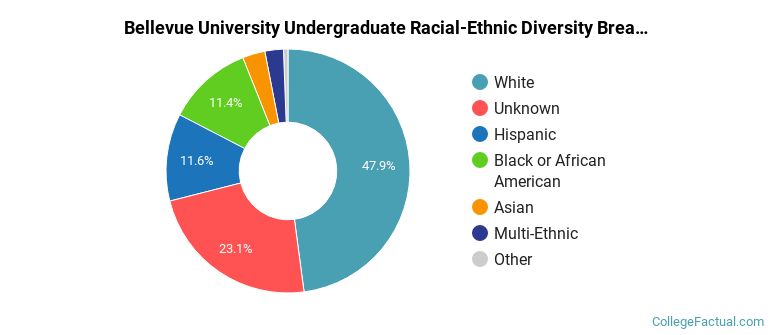
Bellevue University Racial/Ethnic Breakdown of Undergraduates
| Race/Ethnicity | Number |
|---|---|
| White | 3,350 |
| Hispanic | 908 |
| Unknown | 862 |
| Black or African American | 739 |
| Asian | 199 |
| Multi-Ethnic | 143 |
| Native Hawaiian or Pacific Islander | 34 |
| International | 7 |
See racial/ethnic breakdown for all students.
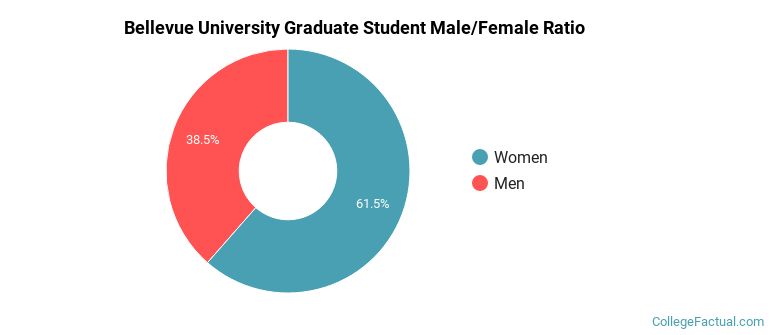
Male/Female Breakdown of Graduate Students
About 56% of full-time grad students are women, and 44% men.
For the gender breakdown for all students, go here.
Bellevue University Racial-Ethnic Breakdown of Graduate Students

| Race/Ethnicity | Number |
|---|---|
| White | 1,324 |
| Unknown | 434 |
| Hispanic | 281 |
| Black or African American | 252 |
| Asian | 142 |
| Multi-Ethnic | 40 |
| Native Hawaiian or Pacific Islander | 8 |
| International | 7 |
See racial/ethnic breakdown for all students.
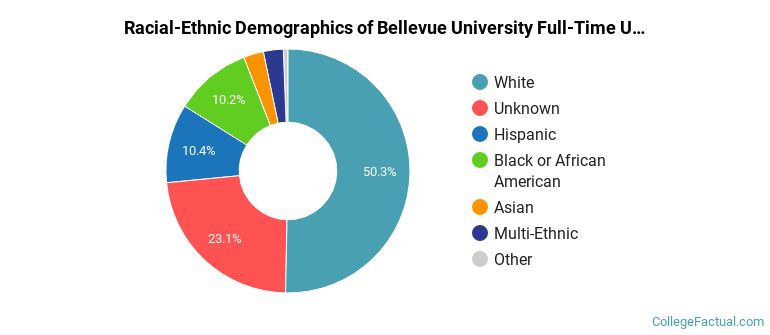
| Race/Ethnicity | Number |
|---|---|
| White | 6,684 |
| Unknown | 1,924 |
| Hispanic | 1,806 |
| Black or African American | 1,686 |
| Asian | 516 |
| Multi-Ethnic | 258 |
| Native Hawaiian or Pacific Islander | 62 |
| International | 17 |
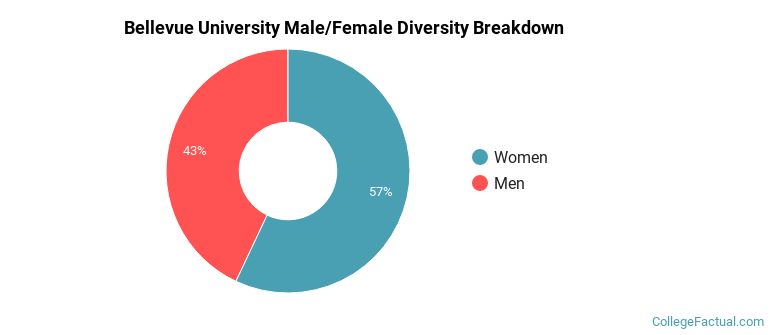
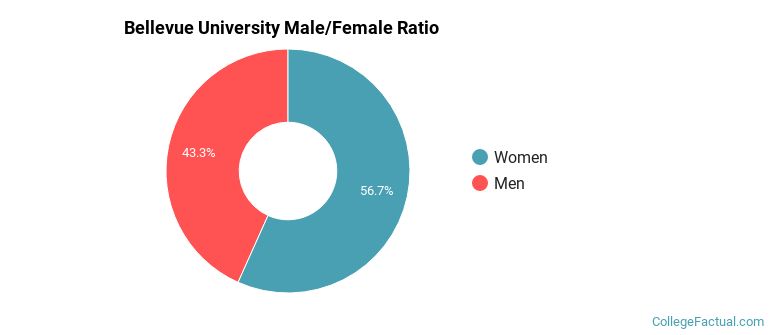
There are approximately 6,946 female students and 6,113 male students at Bellevue University.
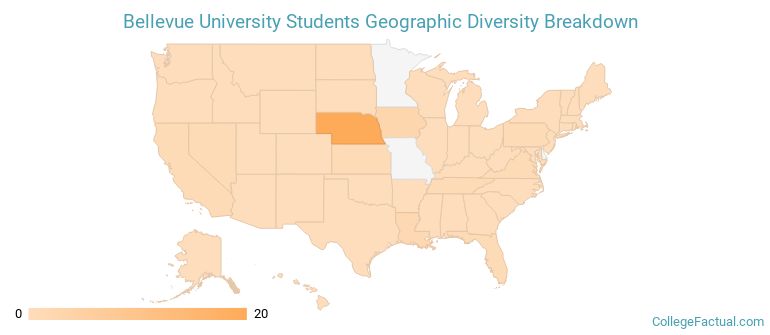
Bellevue University ranks 846 out of 2,183 when it comes to geographic diversity.
37.5% of Bellevue University students come from out of state, and 5.88% come from out of the country.
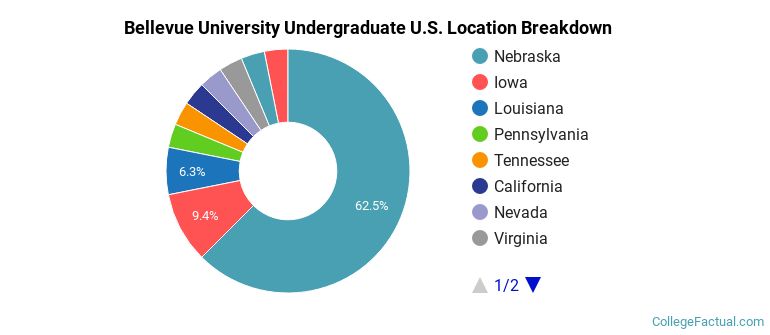
The undergraduate student body is split among 10 states (may include Washington D.C.). Click on the map for more detail.
| State | Amount |
|---|---|
| Nebraska | 20 |
| Iowa | 3 |
| Louisiana | 2 |
| California | 1 |
| Florida | 1 |
Students from 42 countries are represented at this school, with the majority of the international students coming from India, China, and Nepal.
Learn more about international students at Bellevue University.
A traditional college student is defined as being between the ages of 18-21. At Bellevue University, 5.96% of students fall into that category, compared to the national average of 60%.
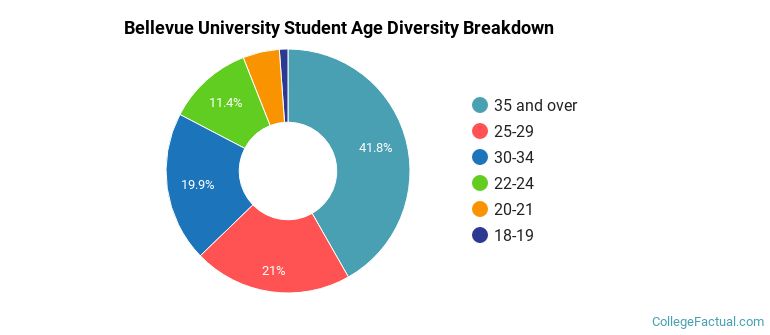
| Student Age Group | Amount |
|---|---|
| 35 and over | 3,601 |
| 25-29 | 1,812 |
| 30-34 | 1,716 |
| 22-24 | 979 |
| 20-21 | 418 |
| 18-19 | 98 |
| Under 18 | 0 |
Footnotes
*The racial-ethnic minorities count is calculated by taking the total number of students and subtracting white students, international students, and students whose race/ethnicity was unknown. This number is then divided by the total number of students at the school to obtain the racial-ethnic minorities percentage.
References
Department of Homeland Security Citizenship and Immigration Services
Image Credit: By Infodegestion under License