Below are the key facts about this program at Belmont University. You can study it at the Bachelor’s level. Jump to any of the following sections:
The following degree levels are offered in fine & studio arts at Belmont University, along with how many graduates complete each level annually.Degree Level Annual Graduates Bachelor’s 9
During the most recent reporting year, Belmont University conferred 9 bachelor’s degrees in fine & studio arts.
Belmont University is not yet ranked for fine & studio arts at the bachelor’s level.
Information about average full-time undergraduate tuition and fees is shown in the table below.In State Out of State Tuition $36,650 $40,560 Fees $1,980 $1,980
Find out more about Belmont University tuition and fees.
For the most recent academic year available, 22% of fine & studio arts bachelor’s degrees went to men and 78% went to women.
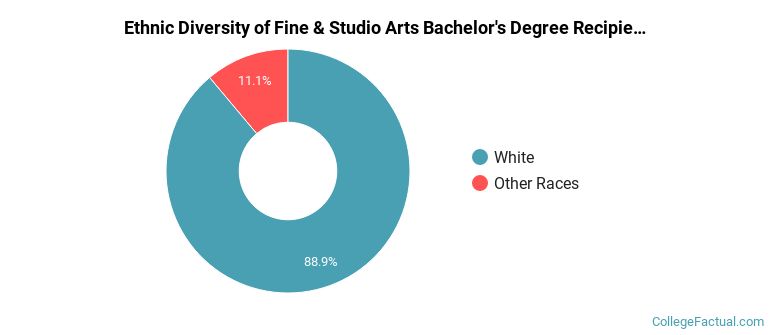
 The majority of fine & studio arts bachelor’s degree graduates at Belmont University were White. Roughly 89% of graduates fell into this category.
The following table and chart show the ethnic background for students who recently graduated from Belmont University with a bachelor’s in fine & studio arts.
| Ethnic Background | Number of Students |
|---|---|
| Asian | 0 |
| Black or African American | 0 |
| Hispanic or Latino | 0 |
| White | 8 |
| Non-Resident Aliens | 0 |
| Other Races | 1 |
Belmont University granted 5 bachelor’s degrees in art/art studies, general in the most recent reporting year — 60% to women and 40% to men. Most of these graduates identified as White (80%).
Belmont University conferred 4 bachelor’s completions in fine/studio arts, general in the most recent reporting year — 100% to women and 0% to men. The largest share of these graduates were White (100%).