Benedictine U total enrollment is approximately 3,779 students. 1,939 are undergraduates and 342 are graduate students.
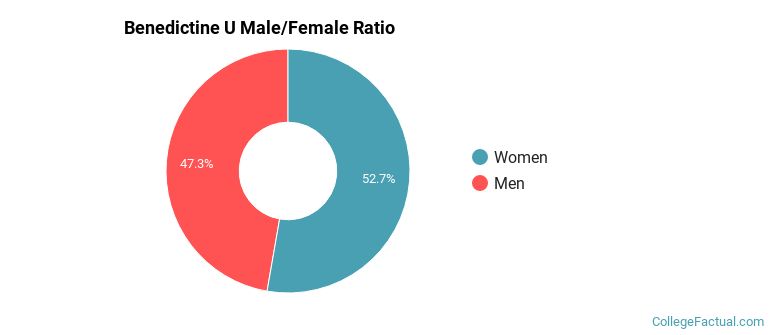
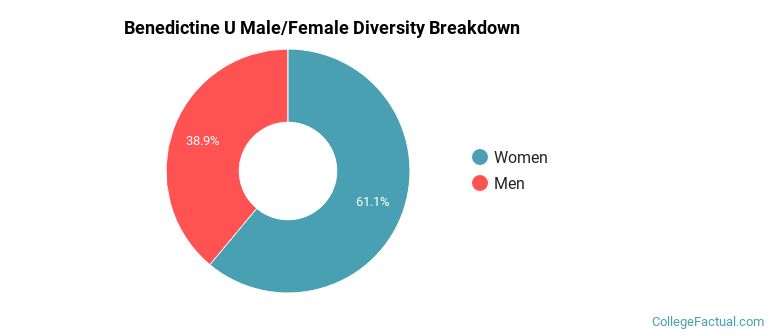
Male/Female Breakdown of Undergraduates
The full-time Benedictine U undergraduate population is made up of 50% women, and 50% men.
For the gender breakdown for all students, go here.
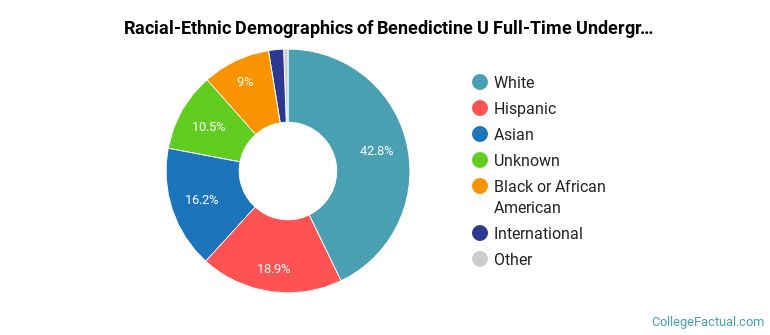
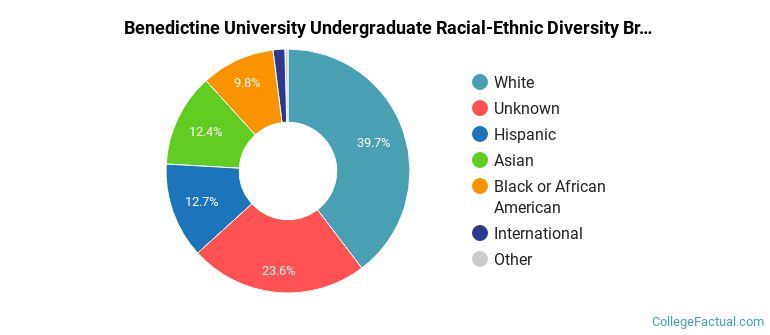
Benedictine U Racial/Ethnic Breakdown of Undergraduates
| Race/Ethnicity | Number |
|---|---|
| White | 809 |
| Hispanic | 346 |
| Asian | 320 |
| Unknown | 193 |
| Black or African American | 174 |
| Multi-Ethnic | 39 |
| International | 22 |
| Native Hawaiian or Pacific Islander | 11 |
See racial/ethnic breakdown for all students.
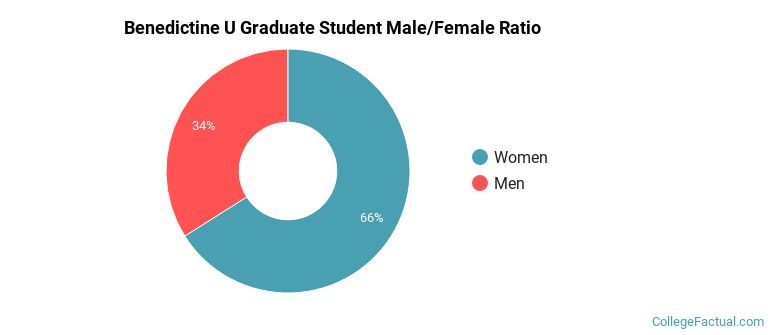
Male/Female Breakdown of Graduate Students
About 70% of full-time grad students are women, and 30% men.
For the gender breakdown for all students, go here.
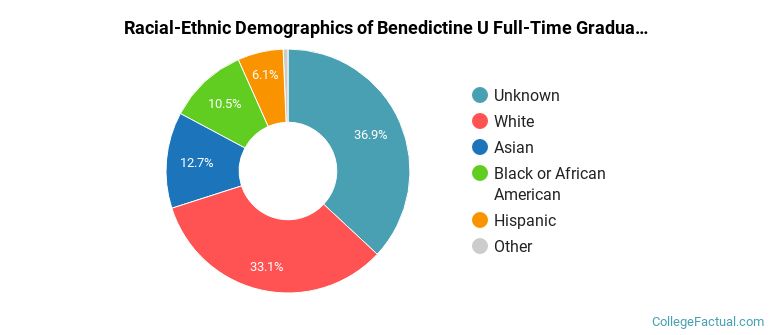
Benedictine U Racial-Ethnic Breakdown of Graduate Students
| Race/Ethnicity | Number |
|---|---|
| Unknown | 136 |
| White | 117 |
| Asian | 43 |
| Black or African American | 22 |
| Hispanic | 15 |
| International | 7 |
| Multi-Ethnic | 1 |
| Native Hawaiian or Pacific Islander | 0 |
See racial/ethnic breakdown for all students.
| Race/Ethnicity | Number |
|---|---|
| White | 1,500 |
| Unknown | 789 |
| Asian | 504 |
| Hispanic | 481 |
| Black or African American | 353 |
| Multi-Ethnic | 60 |
| International | 46 |
| Native Hawaiian or Pacific Islander | 13 |
There are approximately 2,237 female students and 1,542 male students at Benedictine U.
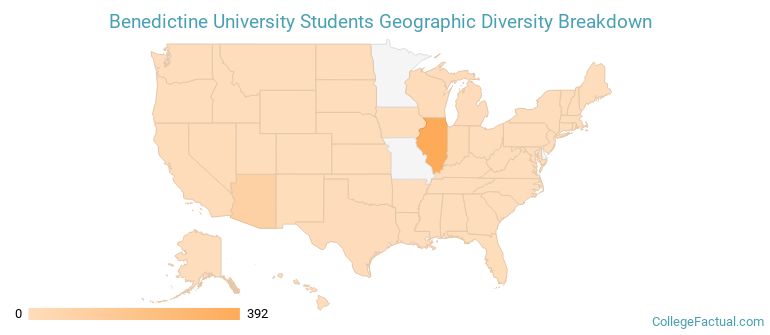
Benedictine U ranks 827 out of 2,183 when it comes to geographic diversity.
29.08% of Benedictine U students come from out of state, and 0% come from out of the country.
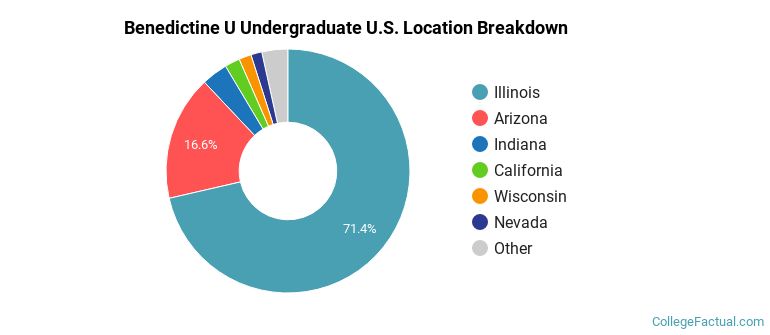
The undergraduate student body is split among 15 states (may include Washington D.C.). Click on the map for more detail.
| State | Amount |
|---|---|
| Illinois | 392 |
| Arizona | 91 |
| Indiana | 19 |
| California | 11 |
| Wisconsin | 9 |
Students from 19 countries are represented at this school, with the majority of the international students coming from China, Libya, and India.
Learn more about international students at Benedictine U.
A traditional college student is defined as being between the ages of 18-21. At Benedictine U, 34.18% of students fall into that category, compared to the national average of 60%.
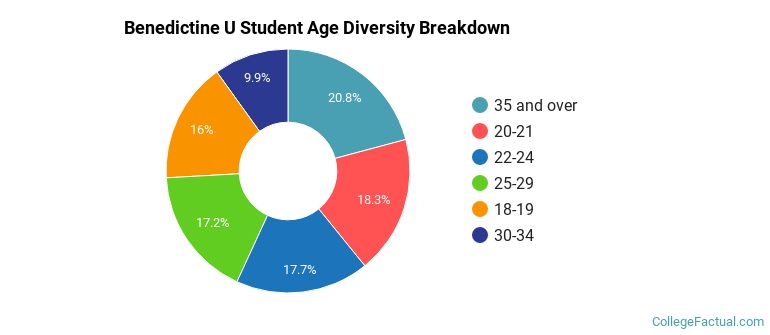
| Student Age Group | Amount |
|---|---|
| 35 and over | 1,059 |
| 20-21 | 931 |
| 22-24 | 900 |
| 25-29 | 876 |
| 18-19 | 812 |
| 30-34 | 504 |
| Under 18 | 0 |
Footnotes
*The racial-ethnic minorities count is calculated by taking the total number of students and subtracting white students, international students, and students whose race/ethnicity was unknown. This number is then divided by the total number of students at the school to obtain the racial-ethnic minorities percentage.
References
Department of Homeland Security Citizenship and Immigration Services
Image Credit: By Pbrozynski under License
Read College Factual's Diversity Ranking Methodology.