Berry total enrollment is approximately 2,125 students. 1,982 are undergraduates and 51 are graduate students.
Male/Female Breakdown of Undergraduates
The full-time Berry undergraduate population is made up of 62% women, and 38% men.

For the gender breakdown for all students, go here.
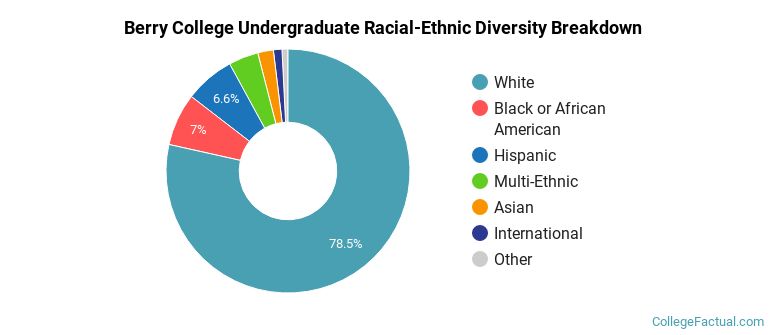
Berry Racial/Ethnic Breakdown of Undergraduates

| Race/Ethnicity | Number |
|---|---|
| White | 1,491 |
| Hispanic | 160 |
| Black or African American | 147 |
| Multi-Ethnic | 106 |
| Asian | 50 |
| International | 16 |
| Unknown | 7 |
| Native Hawaiian or Pacific Islander | 0 |
See racial/ethnic breakdown for all students.
Male/Female Breakdown of Graduate Students
About 69% of full-time grad students are women, and 31% men.

For the gender breakdown for all students, go here.
Berry Racial-Ethnic Breakdown of Graduate Students

| Race/Ethnicity | Number |
|---|---|
| White | 31 |
| Black or African American | 14 |
| Unknown | 3 |
| Multi-Ethnic | 2 |
| Asian | 1 |
| Hispanic | 0 |
| Native Hawaiian or Pacific Islander | 0 |
| International | 0 |
See racial/ethnic breakdown for all students.
| Race/Ethnicity | Number |
|---|---|
| White | 1,601 |
| Black or African American | 166 |
| Hispanic | 163 |
| Multi-Ethnic | 110 |
| Asian | 52 |
| International | 16 |
| Unknown | 12 |
| Native Hawaiian or Pacific Islander | 0 |

There are approximately 1,320 female students and 805 male students at Berry.
Berry ranks 677 out of 2,183 when it comes to geographic diversity.
38.23% of Berry students come from out of state, and 0.56% come from out of the country.

The undergraduate student body is split among 26 states (may include Washington D.C.). Click on the map for more detail.

| State | Amount |
|---|---|
| Georgia | 327 |
| Florida | 47 |
| Tennessee | 44 |
| Alabama | 27 |
| North Carolina | 24 |
Students from 13 countries are represented at this school, with the majority of the international students coming from Costa Rica, Canada, and Germany.
Learn more about international students at Berry.
A traditional college student is defined as being between the ages of 18-21. At Berry, 81.75% of students fall into that category, compared to the national average of 60%.

| Student Age Group | Amount |
|---|---|
| 20-21 | 919 |
| 18-19 | 806 |
| 22-24 | 237 |
| 35 and over | 93 |
| 25-29 | 23 |
| 30-34 | 19 |
| Under 18 | 0 |
Footnotes
*The racial-ethnic minorities count is calculated by taking the total number of students and subtracting white students, international students, and students whose race/ethnicity was unknown. This number is then divided by the total number of students at the school to obtain the racial-ethnic minorities percentage.
References
Department of Homeland Security Citizenship and Immigration Services
Image Credit: By Froggerlaura under License