Explore the best ranked schools for the programs you are most interested in.
Big Bend Technical College was not ranked in College Factual's Best Overall Colleges report this year. This may be because not enough data was available.
If you are worried about getting into Big Bend Technical College, don't be. The school has a liberal open admissions policy, which means you only need to meet basic requirements in order to be admitted. Still, be sure to submit a complete application and provide any other requested materials.
The student to faculty ratio is often used to estimate how much interaction there is between professors and their students at a college or university. At Big Bend Technical College, this ratio is 14 to 1, which is on par with the national average of 15 to 1. That's not bad at all.
Big Bend Technical College has a freshmen retention rate of 78%. That's a good sign that full-time students like the school and their professors enough to want to stick around for another year. It's also a sign that the admissions team did a good job in choosing applicants who were a good fit for the school.
During the 2017-2018 academic year, there were 203 undergraduates at Big Bend Technical College with 121 being full-time and 82 being part-time.
The net price is calculated by adding tuition, room, board and other costs and subtracting financial aid.Note that the net price is typically less than the published for a school. For more information on the sticker price of Big Bend Technical College, see our tuition and fees and room and board pages.
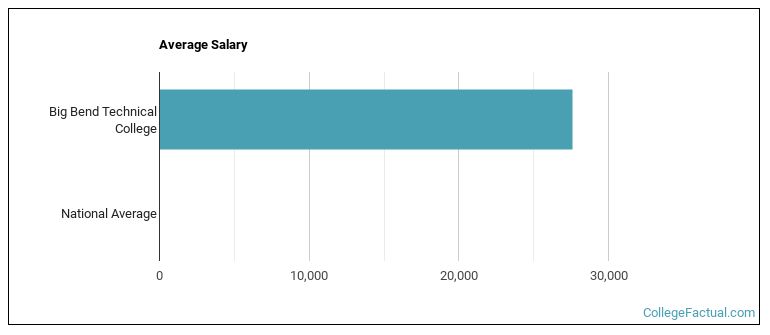
See which majors at Big Bend Technical College make the most money.
Get more details about the location of Big Bend Technical College.

Contact details for Big Bend Technical College are given below.
| Contact Details | |
|---|---|
| Address: | 3233 South Byron Butler Parkway, Perry, FL 32348 |
| Phone: | 850-838-2545 |
| Website: | https://www.bbtc.edu/ |
| Most Popular Majors | Bachelor’s Degrees | Average Salary of Graduates |
|---|---|---|
| Practical Nursing & Nursing Assistants | 73 | NA |
| Clinical/Medical Laboratory Science | 25 | NA |
| Electromechanical Engineering Technology | 22 | NA |
| Vehicle Maintenance & Repair | 7 | NA |
| Heavy/Industrial Equipment Maintenance | 5 | NA |
| Somatic Bodywork & Therapeutic Services | 4 | NA |
| Health & Medical Administrative Services | 3 | NA |
| Electronics Engineering Technology | 1 | NA |
| Precision Metal Working | 1 | NA |
Footnotes
*The racial-ethnic minorities count is calculated by taking the total number of students and subtracting white students, international students, and students whose race/ethnicity was unknown. This number is then divided by the total number of students at the school to obtain the racial-ethnic minorities percentage.
References
More about our data sources and methodologies.