Biola total enrollment is approximately 5,815 students. 3,391 are undergraduates and 834 are graduate students.
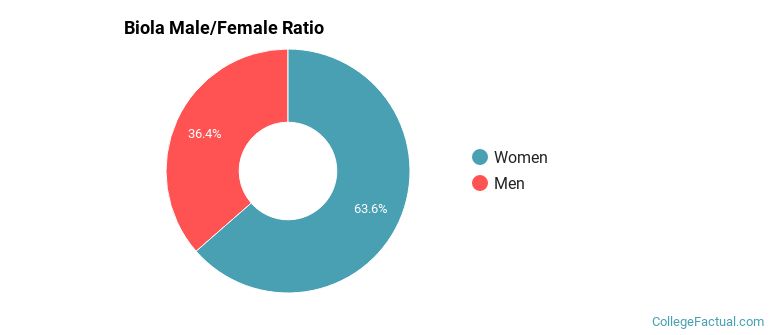
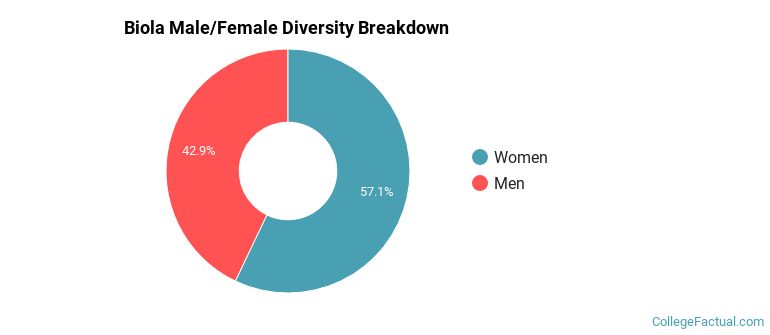
Male/Female Breakdown of Undergraduates
The full-time Biola undergraduate population is made up of 64% women, and 36% men.
For the gender breakdown for all students, go here.
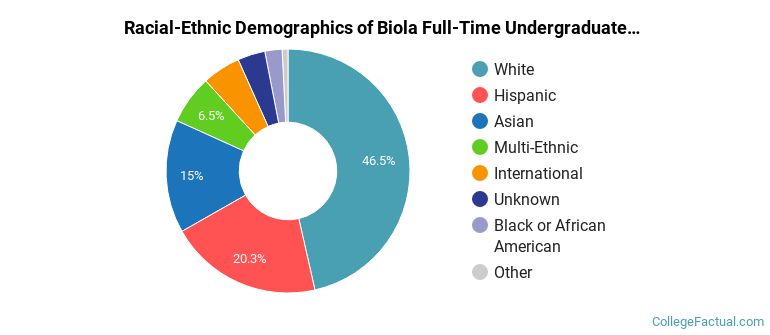
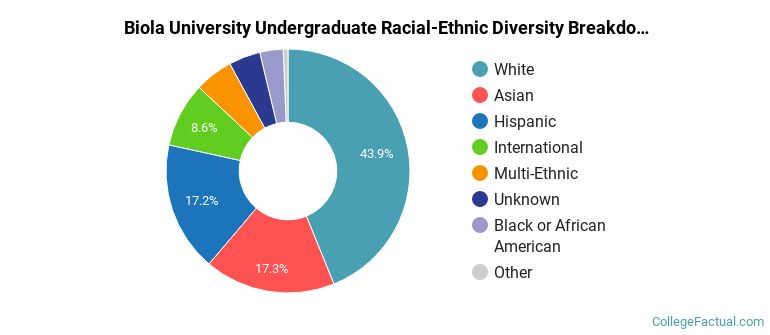
Biola Racial/Ethnic Breakdown of Undergraduates
| Race/Ethnicity | Number |
|---|---|
| White | 1,510 |
| Hispanic | 681 |
| Asian | 531 |
| Multi-Ethnic | 230 |
| International | 179 |
| Unknown | 138 |
| Black or African American | 92 |
| Native Hawaiian or Pacific Islander | 22 |
See racial/ethnic breakdown for all students.
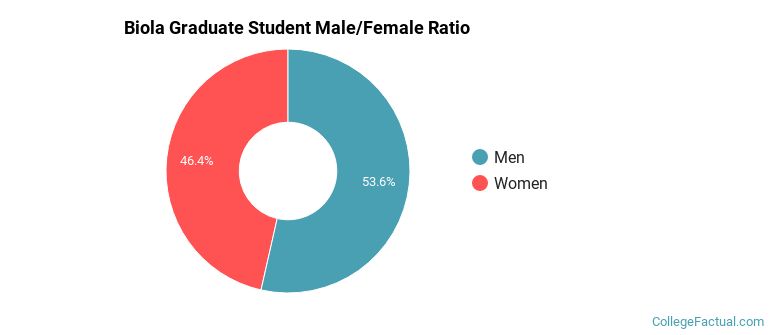
Male/Female Breakdown of Graduate Students
About 46% of full-time grad students are women, and 54% men.
For the gender breakdown for all students, go here.
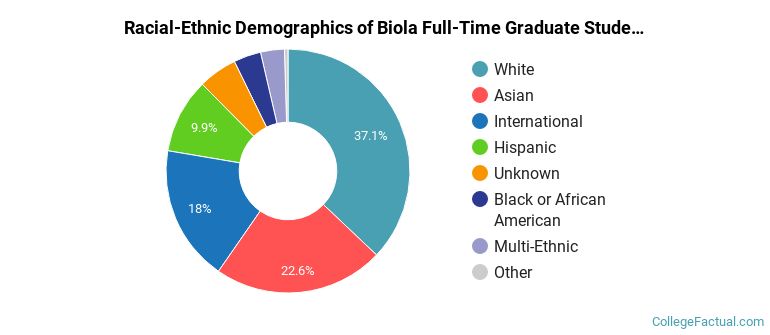
Biola Racial-Ethnic Breakdown of Graduate Students
| Race/Ethnicity | Number |
|---|---|
| White | 300 |
| Asian | 184 |
| International | 159 |
| Hispanic | 90 |
| Unknown | 40 |
| Multi-Ethnic | 29 |
| Black or African American | 25 |
| Native Hawaiian or Pacific Islander | 5 |
See racial/ethnic breakdown for all students.
| Race/Ethnicity | Number |
|---|---|
| White | 2,410 |
| Asian | 1,008 |
| Hispanic | 1,002 |
| International | 541 |
| Multi-Ethnic | 306 |
| Unknown | 273 |
| Black or African American | 186 |
| Native Hawaiian or Pacific Islander | 72 |
There are approximately 3,296 female students and 2,519 male students at Biola.
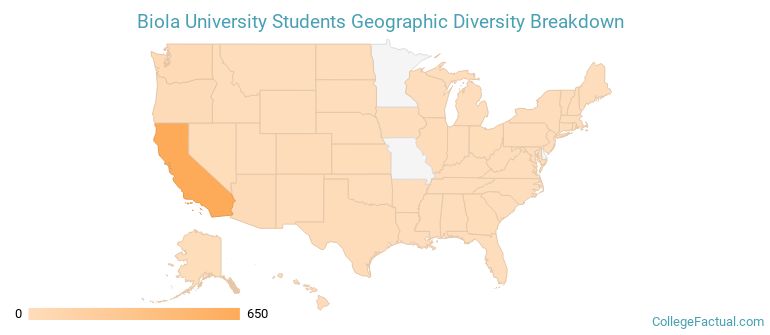
Biola ranks 544 out of 2,183 when it comes to geographic diversity.
24.24% of Biola students come from out of state, and 0% come from out of the country.
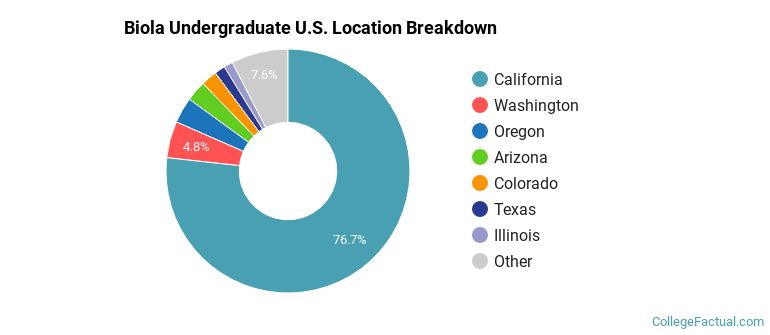
The undergraduate student body is split among 34 states (may include Washington D.C.). Click on the map for more detail.
| State | Amount |
|---|---|
| California | 650 |
| Washington | 41 |
| Oregon | 29 |
| Arizona | 23 |
| Colorado | 18 |
Students from 45 countries are represented at this school, with the majority of the international students coming from South Korea, Indonesia, and China.
Learn more about international students at Biola.
A traditional college student is defined as being between the ages of 18-21. At Biola, 52.56% of students fall into that category, compared to the national average of 60%.
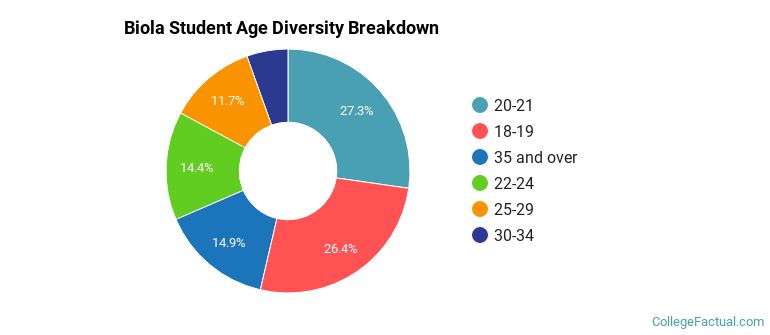
| Student Age Group | Amount |
|---|---|
| 20-21 | 1,649 |
| 18-19 | 1,595 |
| 35 and over | 899 |
| 22-24 | 869 |
| 25-29 | 705 |
| 30-34 | 331 |
| Under 18 | 0 |
Footnotes
*The racial-ethnic minorities count is calculated by taking the total number of students and subtracting white students, international students, and students whose race/ethnicity was unknown. This number is then divided by the total number of students at the school to obtain the racial-ethnic minorities percentage.
References
Department of Homeland Security Citizenship and Immigration Services
Image Credit: By Robert J. Boser under License
Find out how College Factual created their Diversity Rankings.