We’ve pulled together the essential facts you should know about the program at BHSU. You can study it at the Bachelor’s, Certificate levels. Jump to any of the following sections:
The following degree levels are available for film, video & photographic arts at BHSU, along with how many graduates complete each level annually.Degree Level Annual Graduates Bachelor’s 7 Certificate 2
During the most recent reporting year, Black Hills State University handed out 7 bachelor’s degrees in film, video & photographic arts.
BHSU is not currently ranked for film, video & photographic arts at the bachelor’s level.
Information about average full-time undergraduate tuition and fees is shown in the table below.In State Out of State Tuition $7,700 $10,718 Fees $1,300 $1,300
Read more about BHSU tuition and fees.
Among recent graduates, 29% of film, video & photographic arts bachelor’s degrees went to men and 71% went to women.
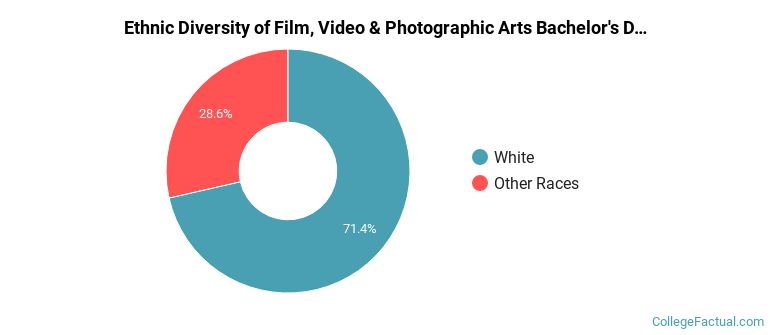
 The largest share of film, video & photographic arts bachelor’s degree graduates at BHSU are White. Roughly 71% of graduates fell into this category.
The following table and chart show the ethnic background for students who recently graduated from Black Hills State University with a bachelor’s in film, video & photographic arts.
| Ethnic Background | Number of Students |
|---|---|
| Asian | 0 |
| Black or African American | 0 |
| Hispanic or Latino | 0 |
| White | 5 |
| Non-Resident Aliens | 0 |
| Other Races | 2 |
BHSU awarded 7 bachelor’s completions in photography in the latest year of data — 71% to women and 29% to men. The most common background among these graduates was White (71%).
During the most recent reporting year, Black Hills State University conferred 2 certificate degrees in film, video & photographic arts.
BHSU is not currently ranked for film, video & photographic arts at the certificate level.
Every one of the 2 students who graduated with a certificate degree in film, video & photographic arts from BHSU were women.
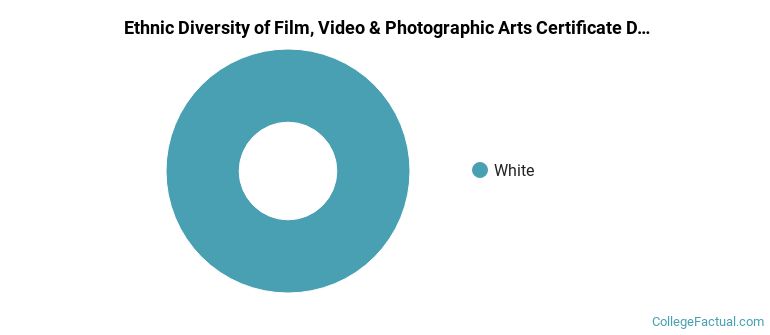
 The largest share of film, video & photographic arts certificate degree graduates at BHSU are White. Approximately 100% of graduates fell into this category.
The following table and chart show the ethnic background for students who recently graduated from Black Hills State University with a certificate in film, video & photographic arts.
| Ethnic Background | Number of Students |
|---|---|
| Asian | 0 |
| Black or African American | 0 |
| Hispanic or Latino | 0 |
| White | 2 |
| Non-Resident Aliens | 0 |
| Other Races | 0 |
BHSU granted 2 certificate completions in photography recently — 100% to women and 0% to men. The most common background among these graduates was White (100%).