Explore the best ranked schools for the programs you are most interested in.
BCC was not ranked in College Factual's 2025 Best Overall Colleges report. This could be for a number of reasons, including lack of data.
Returning adults and other non-traditional students may appreciate the fact that Blackfeet Community College has an open admissions policy. This means that you'll only have to submit basic materials, which may include proof that you completed high school or an equivalent program.
With a student to faculty ratio of 14 to 1, Blackfeet Community College is about average in this regard as the nationwide rate is 15 to 1. While this does not translate directly to class size, it's a good indicator of how much time professors will have to spend with their students on a one-on-one basis.
When estimating how much access students will have to their teachers, some people like to look at what percentage of faculty members are full time. This is because part-time teachers may not have as much time to spend on campus as their full-time counterparts.
The full-time faculty percentage at Blackfeet Community College is 70%. This is higher than the national average of 47%.
During the 2017-2018 academic year, there were 417 undergraduates at BCC with 298 being full-time and 119 being part-time.
| $0-30 K | $30K-48K | $48-75 | $75-110K | $110K + |
|---|---|---|---|---|
| $8,811 | $3,285 | $6,960 | $3,712 | $9,965 |
The net price is calculated by adding tuition, room, board and other costs and subtracting financial aid.Note that the net price is typically less than the published for a school. For more information on the sticker price of BCC, see our tuition and fees and room and board pages.
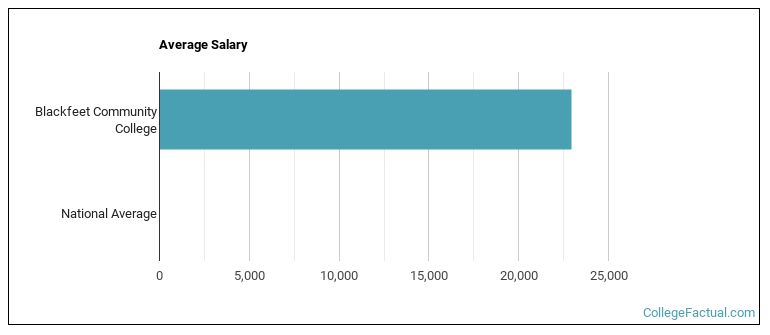
See which majors at Blackfeet Community College make the most money.
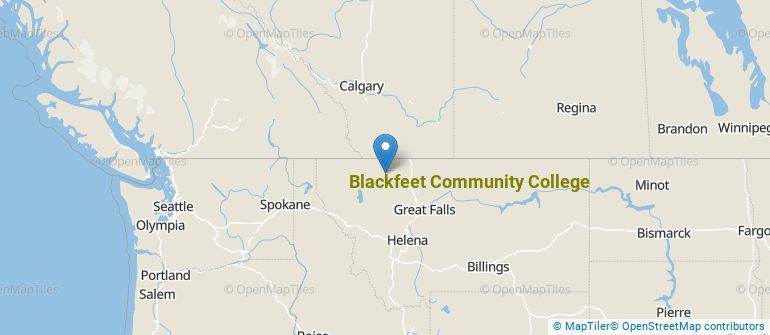
Get more details about the location of Blackfeet Community College.
Contact details for BCC are given below.
| Contact Details | |
|---|---|
| Address: | 504 S.E. East Boundary, Browning, MT 59417-0819 |
| Phone: | 406-338-5441 |
| Website: | bfcc.edu/ |
| Most Popular Majors | Bachelor’s Degrees | Average Salary of Graduates |
|---|---|---|
| Teacher Education Grade Specific | 15 | NA |
| Geological & Earth Sciences | 7 | NA |
| Accounting | 6 | NA |
| Business Administration & Management | 6 | NA |
| Mental & Social Health Services | 5 | NA |
| General Engineering | 4 | NA |
| Health Sciences & Services | 4 | NA |
| General Psychology | 4 | NA |
| Library & Information Science | 3 | NA |
| Criminal Justice & Corrections | 3 | NA |
Online courses area a great option for busy, working students as well as for those who have scheduling conflicts and want to study on their own time. As time goes by, expect to see more and more online learning options become available.
In 2022-2023, 116 students took at least one online class at Blackfeet Community College. This is a decrease from the 292 students who took online classes the previous year.
| Year | Took at Least One Online Class | Took All Classes Online |
|---|---|---|
| 2022-2023 | 116 | 12 |
| 2021-2022 | 292 | 0 |
| 2020-2021 | 0 | 0 |
| 2018-2019 | 0 | 0 |
Learn more about online learning at Blackfeet Community College.
Footnotes
*The racial-ethnic minorities count is calculated by taking the total number of students and subtracting white students, international students, and students whose race/ethnicity was unknown. This number is then divided by the total number of students at the school to obtain the racial-ethnic minorities percentage.
References
More about our data sources and methodologies.