Pope St. John XXIII Seminary total enrollment is approximately 54 students.
See racial/ethnic breakdown for all students.
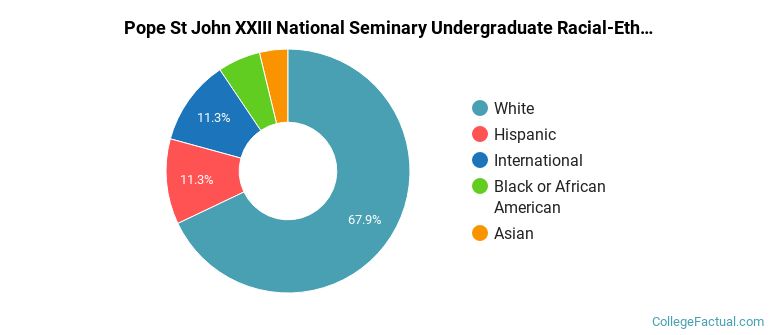
| Race/Ethnicity | Number |
|---|---|
| White | 36 |
| Hispanic | 6 |
| International | 5 |
| Black or African American | 4 |
| Asian | 3 |
| Native Hawaiian or Pacific Islander | 0 |
| Multi-Ethnic | 0 |
| Unknown | 0 |
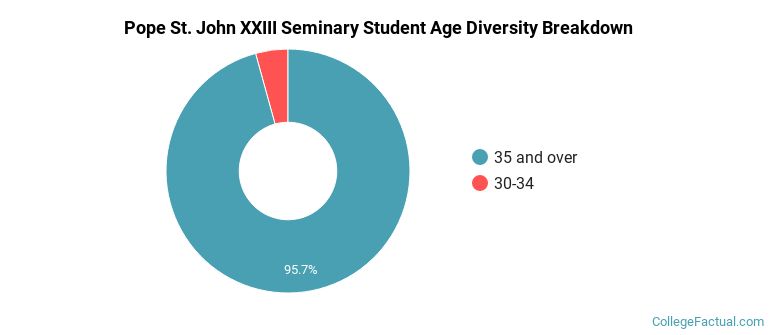
| Student Age Group | Amount |
|---|---|
| 35 and over | 67 |
| 30-34 | 3 |
| 18-19 | 0 |
| 20-21 | 0 |
| 22-24 | 0 |
| 25-29 | 0 |
| Under 18 | 0 |
Footnotes
*The racial-ethnic minorities count is calculated by taking the total number of students and subtracting white students, international students, and students whose race/ethnicity was unknown. This number is then divided by the total number of students at the school to obtain the racial-ethnic minorities percentage.
References
Department of Homeland Security Citizenship and Immigration Services
Find out how College Factual created their Diversity Rankings.