Bloomsburg total enrollment is approximately 8,427 students. 6,939 are undergraduates and 328 are graduate students.
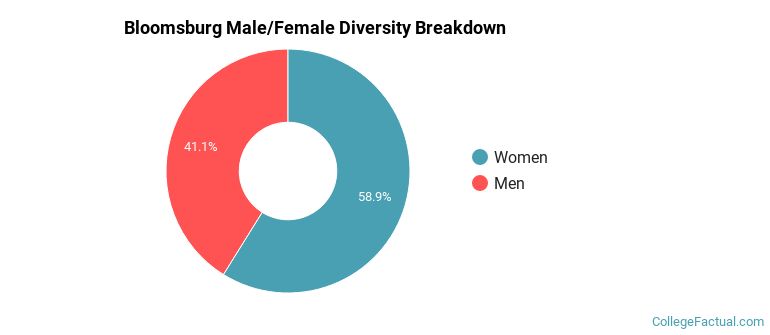
Male/Female Breakdown of Undergraduates
The full-time Bloomsburg undergraduate population is made up of 60% women, and 40% men.
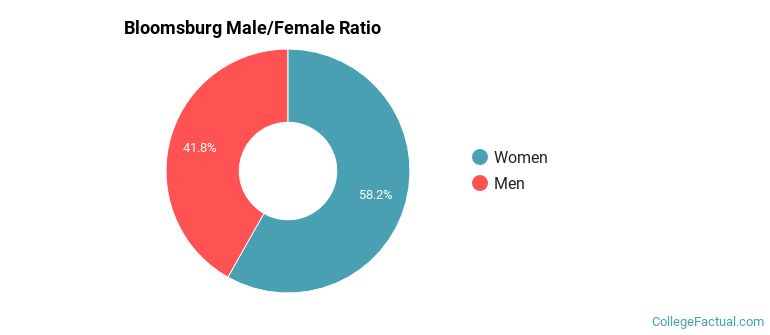
For the gender breakdown for all students, go here.
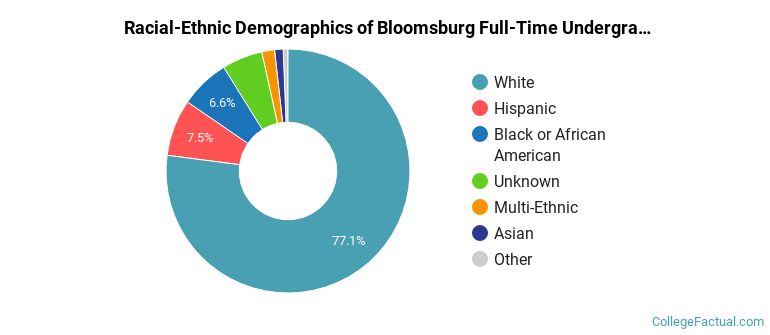
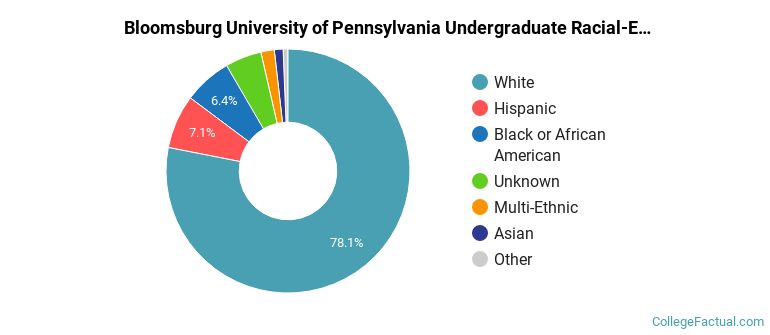
Bloomsburg Racial/Ethnic Breakdown of Undergraduates
| Race/Ethnicity | Number |
|---|---|
| White | 5,322 |
| Hispanic | 522 |
| Black or African American | 462 |
| Unknown | 343 |
| Multi-Ethnic | 156 |
| Asian | 85 |
| International | 24 |
| Native Hawaiian or Pacific Islander | 6 |
See racial/ethnic breakdown for all students.
Male/Female Breakdown of Graduate Students
About 73% of full-time grad students are women, and 27% men.
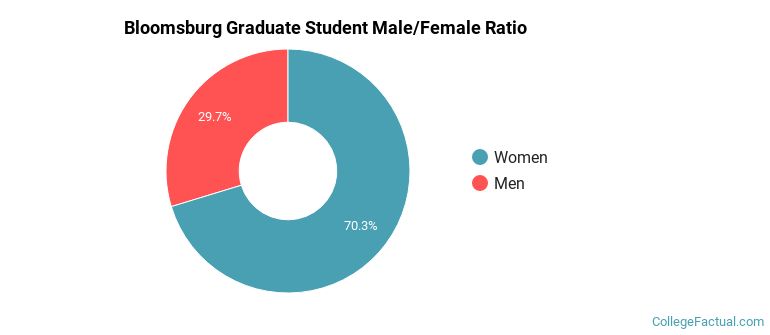
For the gender breakdown for all students, go here.
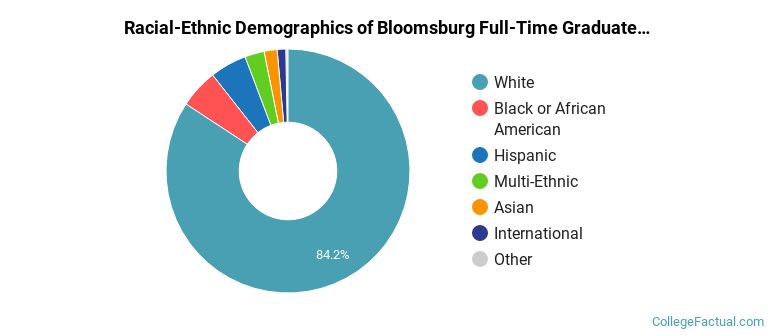
Bloomsburg Racial-Ethnic Breakdown of Graduate Students
| Race/Ethnicity | Number |
|---|---|
| White | 271 |
| Hispanic | 17 |
| Multi-Ethnic | 17 |
| Asian | 7 |
| Black or African American | 5 |
| International | 5 |
| Unknown | 4 |
| Native Hawaiian or Pacific Islander | 0 |
See racial/ethnic breakdown for all students.
| Race/Ethnicity | Number |
|---|---|
| White | 6,514 |
| Hispanic | 639 |
| Black or African American | 517 |
| Unknown | 378 |
| Multi-Ethnic | 195 |
| Asian | 119 |
| International | 32 |
| Native Hawaiian or Pacific Islander | 10 |
There are approximately 5,132 female students and 3,295 male students at Bloomsburg.
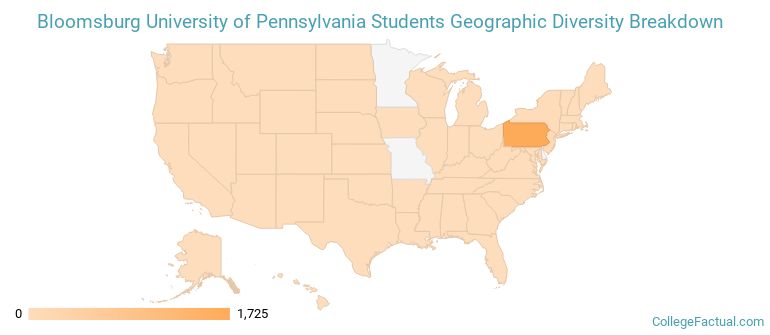
Bloomsburg ranks 1,615 out of 2,183 when it comes to geographic diversity.
9.07% of Bloomsburg students come from out of state, and 0.26% come from out of the country.
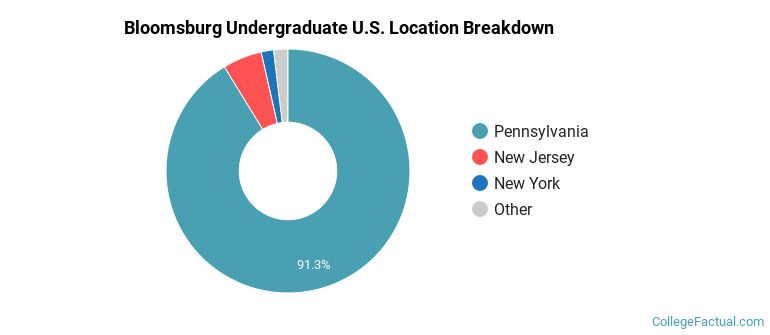
The undergraduate student body is split among 14 states (may include Washington D.C.). Click on the map for more detail.
| State | Amount |
|---|---|
| Pennsylvania | 1,725 |
| New Jersey | 98 |
| New York | 31 |
| Maryland | 16 |
| Connecticut | 7 |
Students from 26 countries are represented at this school, with the majority of the international students coming from Brazil, China, and Spain.
Learn more about international students at Bloomsburg.
A traditional college student is defined as being between the ages of 18-21. At Bloomsburg, 70.89% of students fall into that category, compared to the national average of 60%.
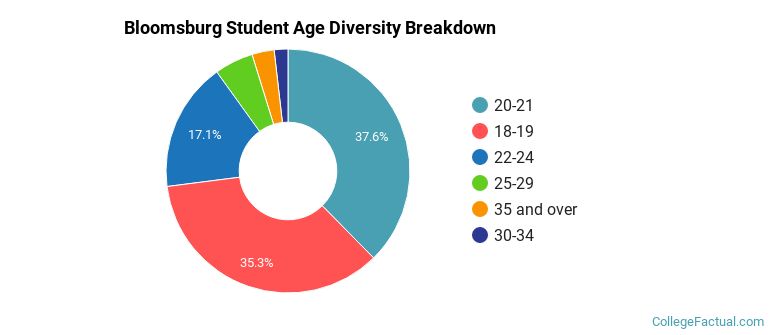
| Student Age Group | Amount |
|---|---|
| 20-21 | 3,384 |
| 18-19 | 3,180 |
| 22-24 | 1,539 |
| 25-29 | 464 |
| 35 and over | 265 |
| 30-34 | 164 |
| Under 18 | 0 |
Footnotes
*The racial-ethnic minorities count is calculated by taking the total number of students and subtracting white students, international students, and students whose race/ethnicity was unknown. This number is then divided by the total number of students at the school to obtain the racial-ethnic minorities percentage.
References