Bluefield College total enrollment is approximately 965 students. 592 are undergraduates and 175 are graduate students.
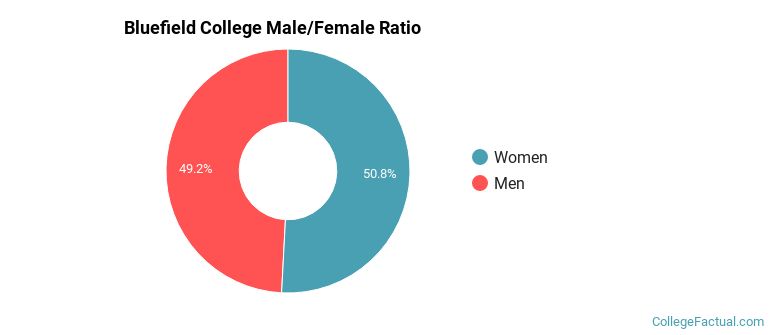
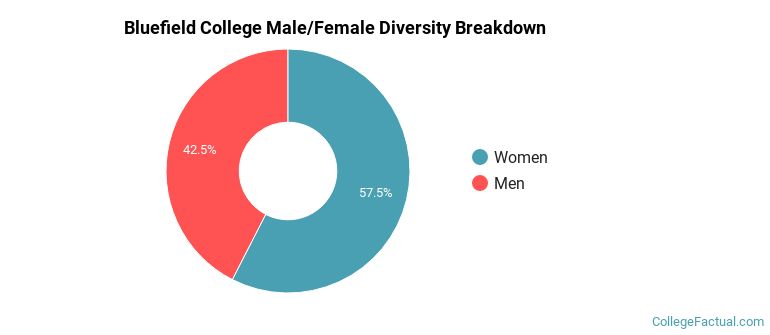
Male/Female Breakdown of Undergraduates
The full-time Bluefield College undergraduate population is made up of 49% women, and 51% men.
For the gender breakdown for all students, go here.
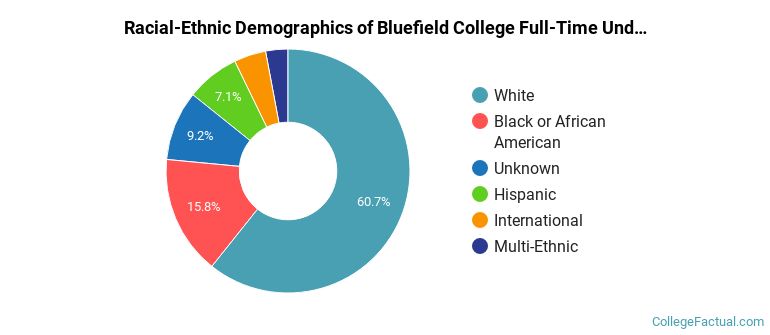
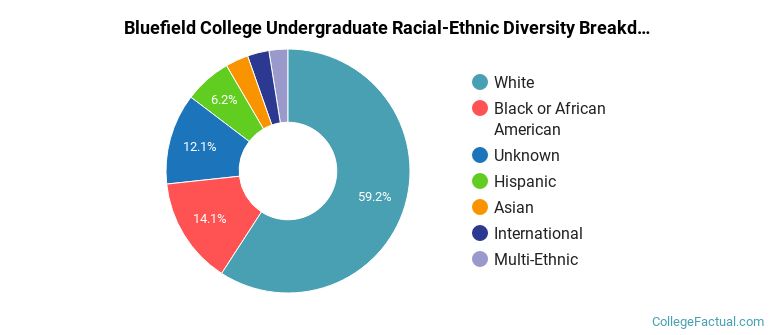
Bluefield College Racial/Ethnic Breakdown of Undergraduates
| Race/Ethnicity | Number |
|---|---|
| Unknown | 252 |
| White | 218 |
| Black or African American | 65 |
| Hispanic | 28 |
| Multi-Ethnic | 16 |
| International | 11 |
| Asian | 0 |
| Native Hawaiian or Pacific Islander | 0 |
See racial/ethnic breakdown for all students.
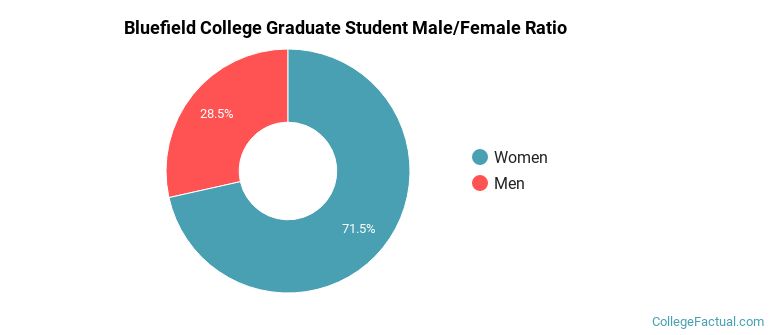
Male/Female Breakdown of Graduate Students
About 67% of full-time grad students are women, and 33% men.
For the gender breakdown for all students, go here.
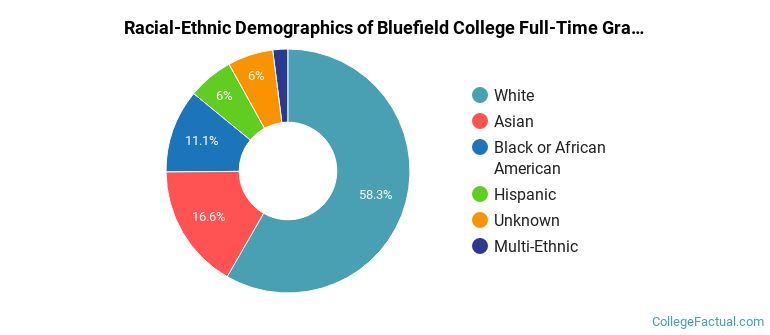
Bluefield College Racial-Ethnic Breakdown of Graduate Students
| Race/Ethnicity | Number |
|---|---|
| Unknown | 107 |
| White | 50 |
| Black or African American | 9 |
| Asian | 3 |
| Hispanic | 2 |
| Native Hawaiian or Pacific Islander | 1 |
| Multi-Ethnic | 1 |
| International | 0 |
See racial/ethnic breakdown for all students.
| Race/Ethnicity | Number |
|---|---|
| Unknown | 469 |
| White | 333 |
| Black or African American | 89 |
| Hispanic | 36 |
| Multi-Ethnic | 19 |
| International | 11 |
| Asian | 3 |
| Native Hawaiian or Pacific Islander | 1 |
There are approximately 543 female students and 422 male students at Bluefield College.
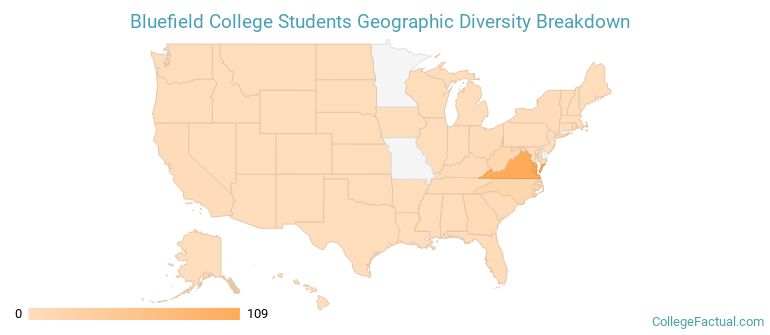
Bluefield College ranks 918 out of 2,183 when it comes to geographic diversity.
34.73% of Bluefield College students come from out of state, and 6.15% come from out of the country.
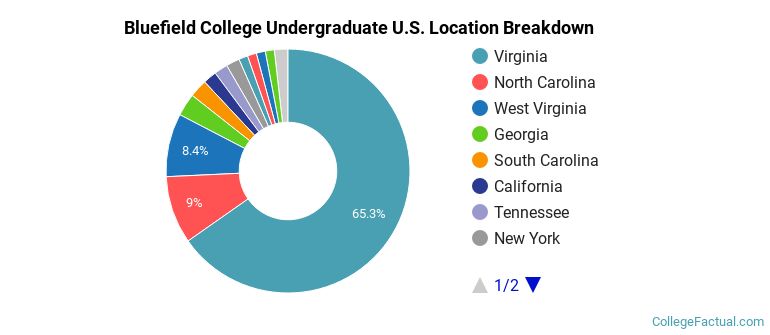
The undergraduate student body is split among 15 states (may include Washington D.C.). Click on the map for more detail.
| State | Amount |
|---|---|
| Virginia | 109 |
| North Carolina | 15 |
| West Virginia | 14 |
| Georgia | 5 |
| South Carolina | 4 |
Students from 27 countries are represented at this school, with the majority of the international students coming from Canada, Brazil, and Germany.
Learn more about international students at Bluefield College.
A traditional college student is defined as being between the ages of 18-21. At Bluefield College, 49.35% of students fall into that category, compared to the national average of 60%.
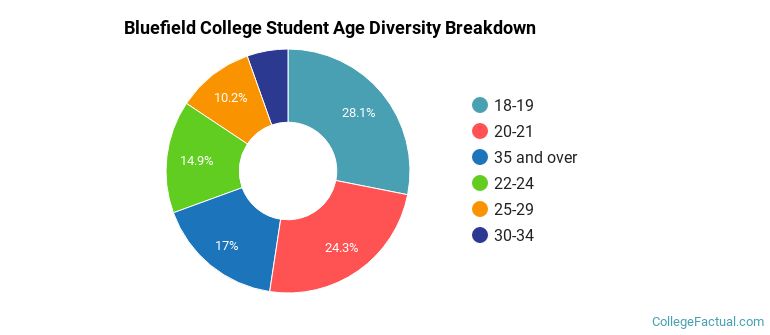
| Student Age Group | Amount |
|---|---|
| 18-19 | 264 |
| 20-21 | 228 |
| 35 and over | 160 |
| 22-24 | 140 |
| 25-29 | 96 |
| 30-34 | 51 |
| Under 18 | 0 |
Footnotes
*The racial-ethnic minorities count is calculated by taking the total number of students and subtracting white students, international students, and students whose race/ethnicity was unknown. This number is then divided by the total number of students at the school to obtain the racial-ethnic minorities percentage.
References