We've pulled together some essential information you should know about the program, including how many students graduate each year, the ethnic diversity of these students, average starting salaries, and more. Also, learn how Boston U ranks among other schools offering degrees in education.
Go directly to any of the following sections:
The education major at Boston U is not ranked on College Factual’s Best Colleges and Universities for General Education. This could be for a number of reasons, such as not having enough data on the major or school to make an accurate assessment of its quality.
During the 2021-2022 academic year, Boston University handed out 0 bachelor's degrees in general education.
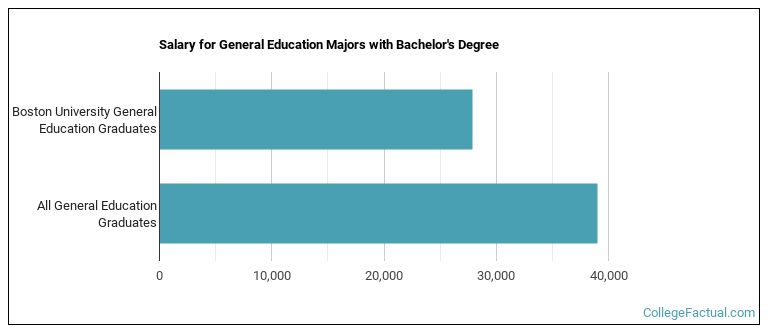
Education majors who earn their bachelor's degree from Boston U go on to jobs where they make a median salary of $27,891 a year. Unfortunately, this is lower than the national average of $38,982 for all education students.
In 2022-2023, the average part-time undergraduate tuition at Boston U was $1,994 per credit hour for both in-state and out-of-state students. Information about average full-time undergraduate tuition and fees is shown in the table below.
| In State | Out of State | |
|---|---|---|
| Tuition | $63,798 | $63,798 |
| Fees | $1,370 | $1,370 |
| Books and Supplies | $1,000 | $1,000 |
| On Campus Room and Board | $18,110 | $18,110 |
| On Campus Other Expenses | $2,085 | $2,085 |
Learn more about Boston U tuition and fees.
Online degrees for the Boston U education bachelor’s degree program are not available at this time. To see if the school offers distance learning options in other areas, visit the Boston U Online Learning page.
| Related Major | Annual Graduates |
|---|---|
| Teacher Education Subject Specific | 235 |
| Curriculum & Instruction | 100 |
| Educational Administration | 69 |
| Special Education | 44 |
| Teacher Education Grade Specific | 40 |
More about our data sources and methodologies.