We've pulled together some essential information you should know about the program, including how many students graduate each year, the ethnic diversity of these students, and more. In addition, we cover how Boston U ranks in comparison to other schools with subject specific ed programs.
Jump to any of the following sections:
Ranked at #3 in College Factual's most recent rankings, Boston U is in the top 1% of the country for subject specific ed students pursuing a bachelor's degree. It is also ranked #1 in Massachusetts.
During the 2021-2022 academic year, Boston University handed out 26 bachelor's degrees in teacher education subject specific. This is a decrease of 21% over the previous year when 33 degrees were handed out.
In 2022, 172 students received their master’s degree in subject specific ed from Boston U. This makes it the #13 most popular school for subject specific ed master’s degree candidates in the country.
In addition, 21 students received their doctoral degrees in subject specific ed in 2022, making the school the #6 most popular school in the United States for this category of students.
In 2022-2023, the average part-time undergraduate tuition at Boston U was $1,994 per credit hour for both in-state and out-of-state students. Information about average full-time undergraduate tuition and fees is shown in the table below.
| In State | Out of State | |
|---|---|---|
| Tuition | $63,798 | $63,798 |
| Fees | $1,370 | $1,370 |
| Books and Supplies | $1,000 | $1,000 |
| On Campus Room and Board | $18,110 | $18,110 |
| On Campus Other Expenses | $2,085 | $2,085 |
Learn more about Boston U tuition and fees.
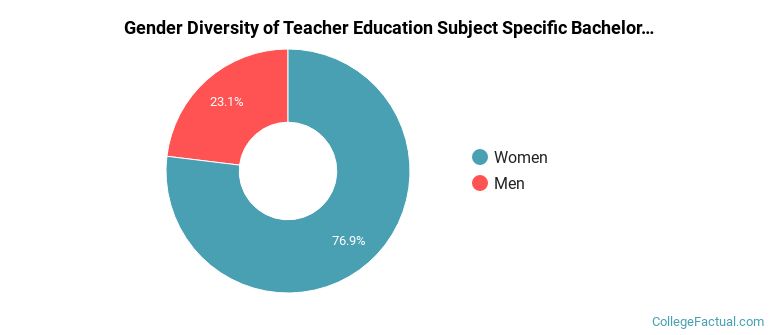
During the 2021-2022 academic year, 26 subject specific ed majors earned their bachelor's degree from Boston U. Of these graduates, 23% were men and 77% were women.
The majority of the students with this major are white. About 58% of 2022 graduates were in this category.
The following table and chart show the ethnic background for students who recently graduated from Boston University with a bachelor's in subject specific ed.
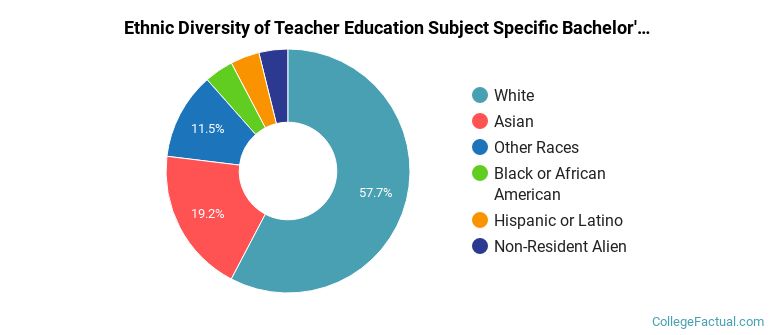
| Ethnic Background | Number of Students |
|---|---|
| Asian | 5 |
| Black or African American | 1 |
| Hispanic or Latino | 1 |
| White | 15 |
| Non-Resident Aliens | 1 |
| Other Races | 3 |
Boston U does not offer an online option for its subject specific ed bachelor’s degree program at this time. To see if the school offers distance learning options in other areas, visit the Boston U Online Learning page.
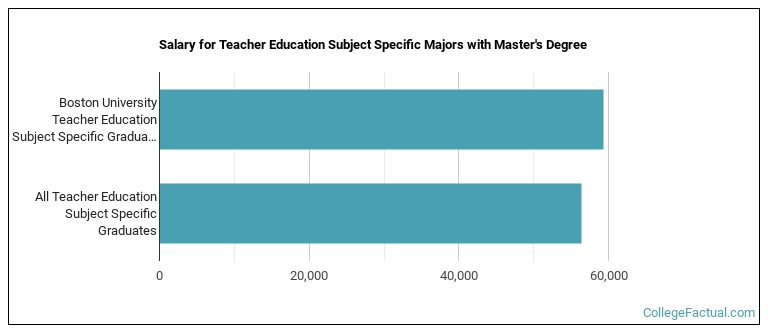
Graduates of the master's subject specific ed program at Boston U make a median salary of $59,382. This is a better than average outcome since the median salary for all subject specific ed graduates with a master's is $56,457.
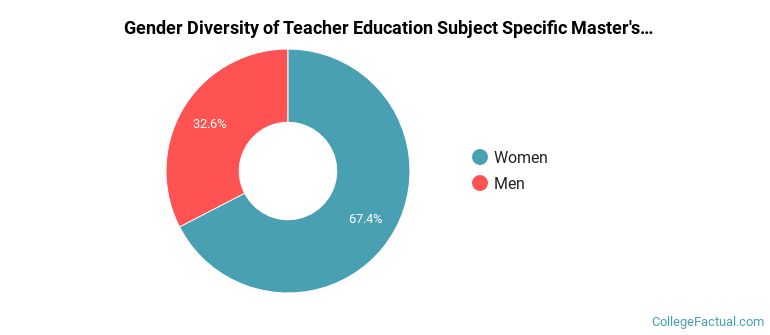
Of the 178 subject specific ed students who graduated with a master's degree in 2021-2022 from Boston U, about 33% were men and 67% were women.
The majority of the students with this major are white. About 72% of 2022 graduates were in this category.
The following table and chart show the ethnic background for students who recently graduated from Boston University with a master's in subject specific ed.
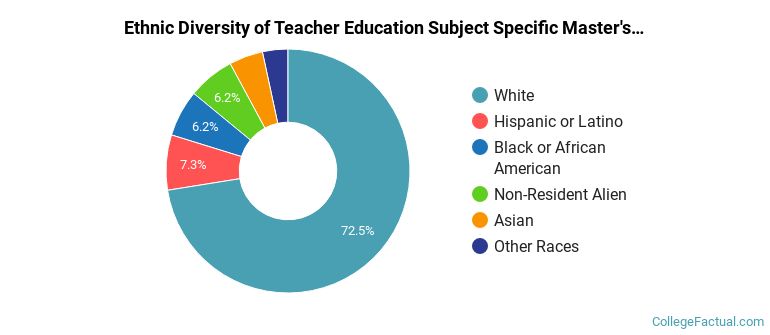
| Ethnic Background | Number of Students |
|---|---|
| Asian | 8 |
| Black or African American | 11 |
| Hispanic or Latino | 13 |
| White | 129 |
| Non-Resident Aliens | 11 |
| Other Races | 6 |
Take a look at the following statistics related to the make-up of the subject specific ed majors at Boston University.
| Related Major | Annual Graduates |
|---|---|
| Curriculum & Instruction | 100 |
| Educational Administration | 69 |
| Special Education | 44 |
| Teacher Education Grade Specific | 40 |
| Teaching English or French | 22 |
View All Teacher Education Subject Specific Related Majors >
More about our data sources and methodologies.