We've pulled together some essential information you should know about the program, including how many students graduate each year, the ethnic diversity of these students, and more. In addition, we cover how Boston U ranks in comparison to other schools with allied health programs.
Jump to any of the following sections:
Learn about start dates, transferring credits, availability of financial aid, and more by contacting the universities below.
Take your associate degree in an allied health field to the next level with this specialized transfer friendly online bachelor of science from Southern New Hampshire University.
The bachelor's program at Boston U was ranked #383 on College Factual's Best Schools for allied health list.
During the 2021-2022 academic year, Boston University handed out 0 bachelor's degrees in allied health professions.
In 2022, 26 students received their master’s degree in allied health from Boston U. This makes it the #200 most popular school for allied health master’s degree candidates in the country.
Part-time undergraduates at Boston U paid an average of $1,994 per credit hour in 2022-2023. This tuition was the same for both in-state and out-of-state students. The average full-time tuition and fees for undergraduates are shown in the table below.
| In State | Out of State | |
|---|---|---|
| Tuition | $63,798 | $63,798 |
| Fees | $1,370 | $1,370 |
| Books and Supplies | $1,000 | $1,000 |
| On Campus Room and Board | $18,110 | $18,110 |
| On Campus Other Expenses | $2,085 | $2,085 |
Learn more about Boston U tuition and fees.
Boston U does not offer an online option for its allied health bachelor’s degree program at this time. To see if the school offers distance learning options in other areas, visit the Boston U Online Learning page.
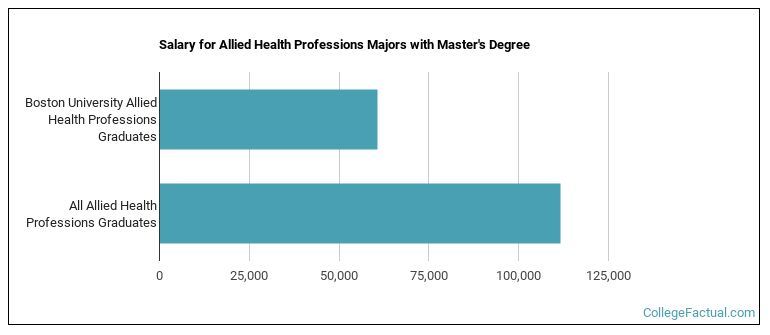
Graduates of the master's allied health program at Boston U make a median salary of $60,615. This is less than what their typical peers from other schools make. Their median salary is $111,759.
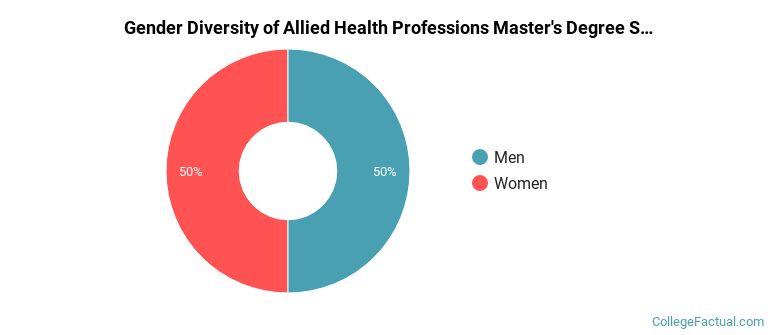
During the 2021-2022 academic year, 18 allied health majors earned their master's degree from Boston U. Of these graduates, 50% were men and 50% were women.
The following table and chart show the ethnic background for students who recently graduated from Boston University with a master's in allied health.
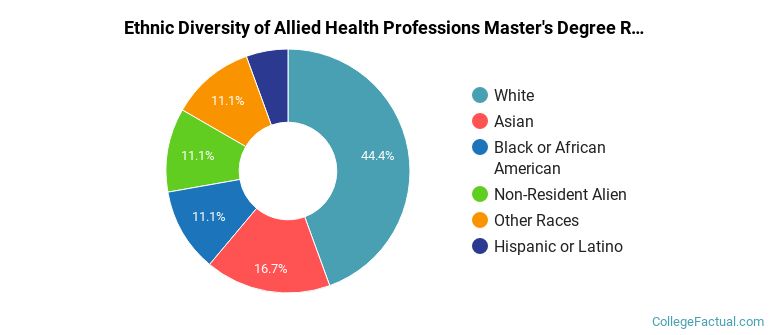
| Ethnic Background | Number of Students |
|---|---|
| Asian | 3 |
| Black or African American | 2 |
| Hispanic or Latino | 1 |
| White | 8 |
| Non-Resident Aliens | 2 |
| Other Races | 2 |
Take a look at the following statistics related to the make-up of the allied health majors at Boston University.
| Related Major | Annual Graduates |
|---|---|
| Public Health | 326 |
| Dentistry | 194 |
| Health Sciences & Services | 179 |
| Medicine | 164 |
| Rehabilitation & Therapeutic Professions | 161 |
More about our data sources and methodologies.
