Here, you'll find out more about the major, including such details as the number of graduates, what degree levels are offered, ethnicity of students, and more. Also, learn how Boston U ranks among other schools offering degrees in nutrition science.
Jump to any of the following sections:
Boston U was ranked #12 on College Factual's most recent list of the best schools for nutrition science majors. This puts the bachelor's program at the school solidly in the top 15% of all colleges and universities in the country. It is also ranked #2 in Massachusetts.
During the 2021-2022 academic year, Boston University handed out 24 bachelor's degrees in nutrition science. This is an increase of 85% over the previous year when 13 degrees were handed out.
In 2022, 40 students received their master’s degree in nutrition science from Boston U. This makes it the #6 most popular school for nutrition science master’s degree candidates in the country.
During the 2022-2023 academic year, part-time undergraduate students at Boston U paid an average of $1,994 per credit hour. No discount was available for in-state students. Information about average full-time undergraduate tuition and fees is shown in the table below.
| In State | Out of State | |
|---|---|---|
| Tuition | $63,798 | $63,798 |
| Fees | $1,370 | $1,370 |
| Books and Supplies | $1,000 | $1,000 |
| On Campus Room and Board | $18,110 | $18,110 |
| On Campus Other Expenses | $2,085 | $2,085 |
Learn more about Boston U tuition and fees.
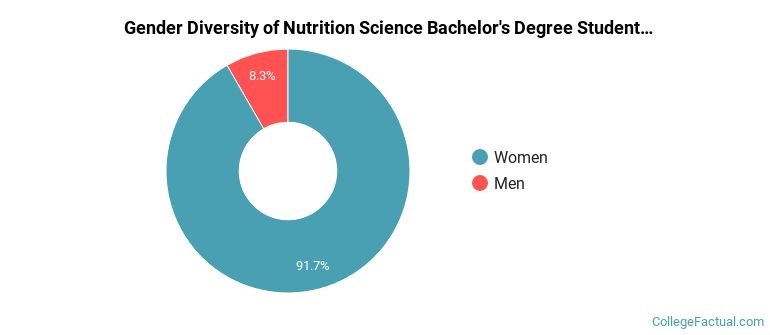
Of the 24 students who earned a bachelor's degree in Nutrition Science from Boston U in 2021-2022, 8% were men and 92% were women.
The following table and chart show the ethnic background for students who recently graduated from Boston University with a bachelor's in nutrition science.
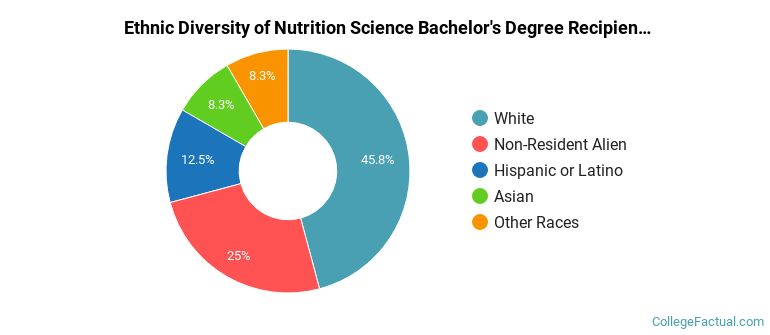
| Ethnic Background | Number of Students |
|---|---|
| Asian | 2 |
| Black or African American | 0 |
| Hispanic or Latino | 3 |
| White | 11 |
| Non-Resident Aliens | 6 |
| Other Races | 2 |
Online degrees for the Boston U nutrition science bachelor’s degree program are not available at this time. To see if the school offers distance learning options in other areas, visit the Boston U Online Learning page.
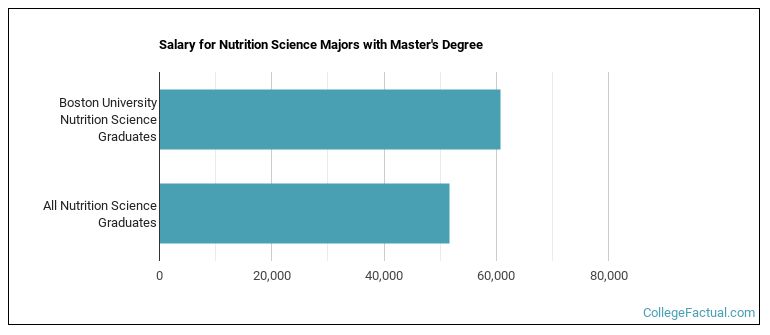
Graduates of the master's nutrition science program at Boston U make a median salary of $60,684. This is a better than average outcome since the median salary for all nutrition science graduates with a master's is $51,741.
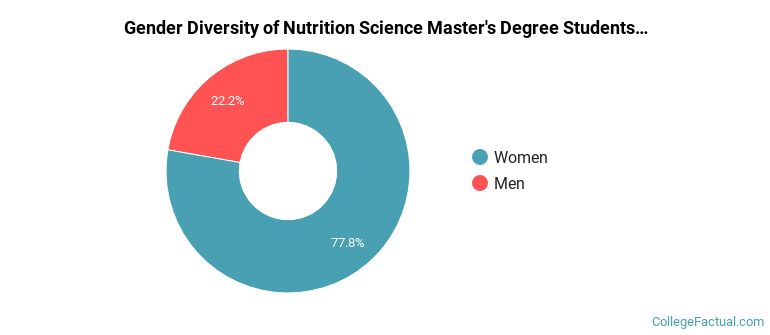
The nutrition science program at Boston U awarded 36 master's degrees in 2021-2022. About 22% of these degrees went to men with the other 78% going to women.
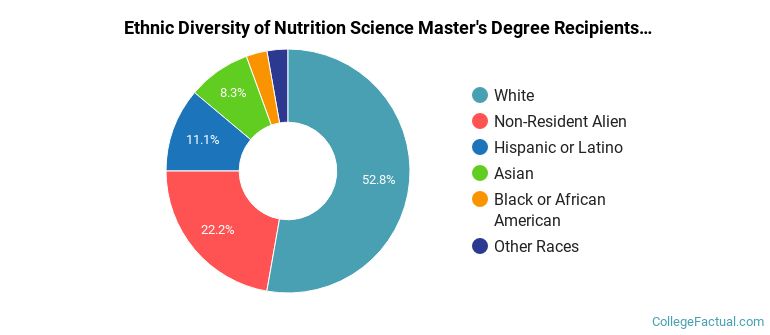
The majority of master's degree recipients in this major at Boston U are white. In the most recent graduating class for which data is available, 53% of students fell into this category.
The following table and chart show the ethnic background for students who recently graduated from Boston University with a master's in nutrition science.
| Ethnic Background | Number of Students |
|---|---|
| Asian | 3 |
| Black or African American | 1 |
| Hispanic or Latino | 4 |
| White | 19 |
| Non-Resident Aliens | 8 |
| Other Races | 1 |
Take a look at the following statistics related to the make-up of the nutrition science majors at Boston University.
| Related Major | Annual Graduates |
|---|---|
| Other Multi/Interdisciplinary Studies | 67 |
| Mathematical Economics | 42 |
| Systems Theory | 38 |
| Classical & Ancient Studies | 6 |
| Historic Preservation | 3 |
More about our data sources and methodologies.