Explore the best ranked schools for the programs you are most interested in.
Brewster Technical College was not ranked in College Factual's Best Overall Colleges report this year. This may be because not enough data was available.
If you are worried about getting into Brewster Technical College, don't be. The school has a liberal open admissions policy, which means you only need to meet basic requirements in order to be admitted. Still, be sure to submit a complete application and provide any other requested materials.
The student to faculty ratio at Brewster Technical College is an impressive 8 to 1. That's quite good when you compare it to the national average of 15 to 1. This is a good sign that students at the school will have more opportunities for one-on-one interactions with their professors.
The freshmen retention rate of 9% tells us that most first-year, full-time students don't stick around for a second year at Brewster Technical College. Students may have a variety of reasons for this, such as only intending to attend a school for one year while they brush up on certain subjects.
During the 2017-2018 academic year, there were 142 full-time undergraduates at Brewster Technical College.
The net price is calculated by adding tuition, room, board and other costs and subtracting financial aid.Note that the net price is typically less than the published for a school. For more information on the sticker price of Brewster Technical College, see our tuition and fees and room and board pages.
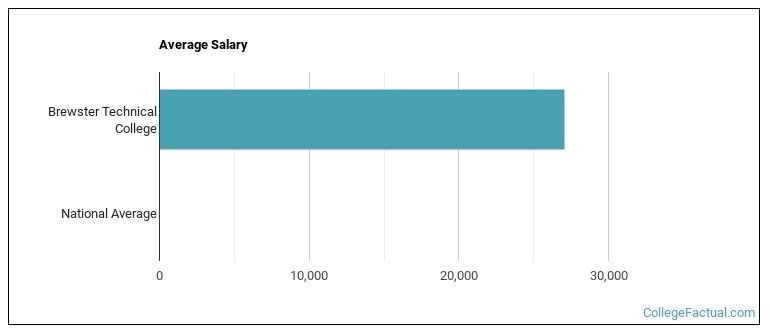
See which majors at Brewster Technical College make the most money.
Get more details about the location of Brewster Technical College.

Contact details for Brewster Technical College are given below.
| Contact Details | |
|---|---|
| Address: | 2222 N. Tampa Street, Tampa, FL 33602 |
| Phone: | 813-276-5448 |
| Website: | www.hillsboroughschools.org/Brewster |
| Most Popular Majors | Bachelor’s Degrees | Average Salary of Graduates |
|---|---|---|
| Information Technology | 119 | NA |
| Clinical/Medical Laboratory Science | 50 | NA |
| Human Development & Family Studies | 23 | NA |
| Vehicle Maintenance & Repair | 20 | NA |
| Teacher Education Grade Specific | 13 | NA |
| Allied Health & Medical Assisting Services | 7 | NA |
| Business Support & Assistant Services | 2 | NA |
Footnotes
*The racial-ethnic minorities count is calculated by taking the total number of students and subtracting white students, international students, and students whose race/ethnicity was unknown. This number is then divided by the total number of students at the school to obtain the racial-ethnic minorities percentage.
References
More about our data sources and methodologies.