Explore the best ranked schools for the programs you are most interested in.
Bridgerland ATC was not ranked in College Factual's Best Overall Colleges report this year. This may be because not enough data was available.
As long as you meet basic requirements, you should not have any trouble getting into Bridgerland Technical College since the school has an open admissions policy. Still, be sure to submit any requested materials and that your application is completed in full.
The student to faculty ratio at Bridgerland Technical College is about average at 16 to 1. This ratio is often used to gauge how many students might be in an average class and how much time professors will have to spend with their students on an individual level. The national average for this metric is 15 to 1.
The freshmen retention rate of 76% tells us that most first-year, full-time students like Bridgerland Technical College enough to come back for another year. This is a fair bit higher than the national average of 68%. That's certainly something to check off in the good column about the school.
During the 2017-2018 academic year, there were 1,469 undergraduates at Bridgerland ATC with 563 being full-time and 906 being part-time.
The net price is calculated by adding tuition, room, board and other costs and subtracting financial aid.Note that the net price is typically less than the published for a school. For more information on the sticker price of Bridgerland ATC, see our tuition and fees and room and board pages.
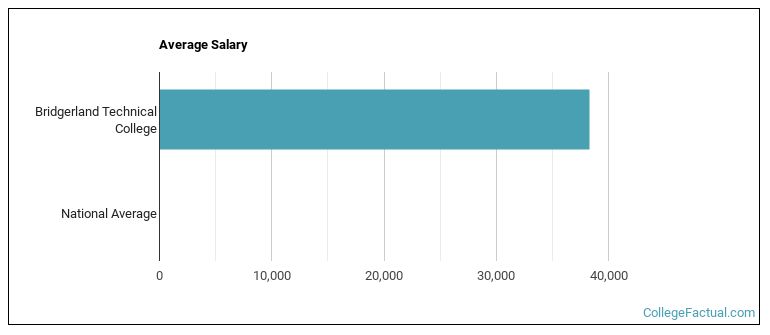
See which majors at Bridgerland Technical College make the most money.
Get more details about the location of Bridgerland Technical College.

Contact details for Bridgerland ATC are given below.
| Contact Details | |
|---|---|
| Address: | 1301 North 600 West, Logan, UT 84321 |
| Phone: | 435-753-6780 |
| Website: | www.btech.edu/ |
| Most Popular Majors | Bachelor’s Degrees | Average Salary of Graduates |
|---|---|---|
| Practical Nursing & Nursing Assistants | 181 | NA |
| Computer Programming | 103 | NA |
| Allied Health & Medical Assisting Services | 103 | NA |
| Cosmetology | 82 | NA |
| Vehicle Maintenance & Repair | 66 | NA |
| Dental Support Services | 65 | NA |
| Heavy/Industrial Equipment Maintenance | 65 | NA |
| Precision Metal Working | 65 | NA |
| Veterinary/Animal Health Technologies/Technicians | 56 | NA |
| Ground Transportation | 49 | NA |
Online learning options are becoming more and more popular at American colleges and universities. Online classes are great for students who have busy schedules or for those who just want to study on their own time.
In 2022-2023, 130 students took at least one online class at Bridgerland Technical College. This is an increase from the 103 students who took online classes the previous year.
| Year | Took at Least One Online Class | Took All Classes Online |
|---|---|---|
| 2022-2023 | 130 | 130 |
| 2021-2022 | 103 | 103 |
| 2020-2021 | 109 | 109 |
| 2018-2019 | 107 | 107 |
Learn more about online learning at Bridgerland Technical College.
Footnotes
*The racial-ethnic minorities count is calculated by taking the total number of students and subtracting white students, international students, and students whose race/ethnicity was unknown. This number is then divided by the total number of students at the school to obtain the racial-ethnic minorities percentage.
References
More about our data sources and methodologies.